Copyright
©The Author(s) 2020.
World J Clin Oncol. Sep 24, 2020; 11(9): 679-704
Published online Sep 24, 2020. doi: 10.5306/wjco.v11.i9.679
Published online Sep 24, 2020. doi: 10.5306/wjco.v11.i9.679
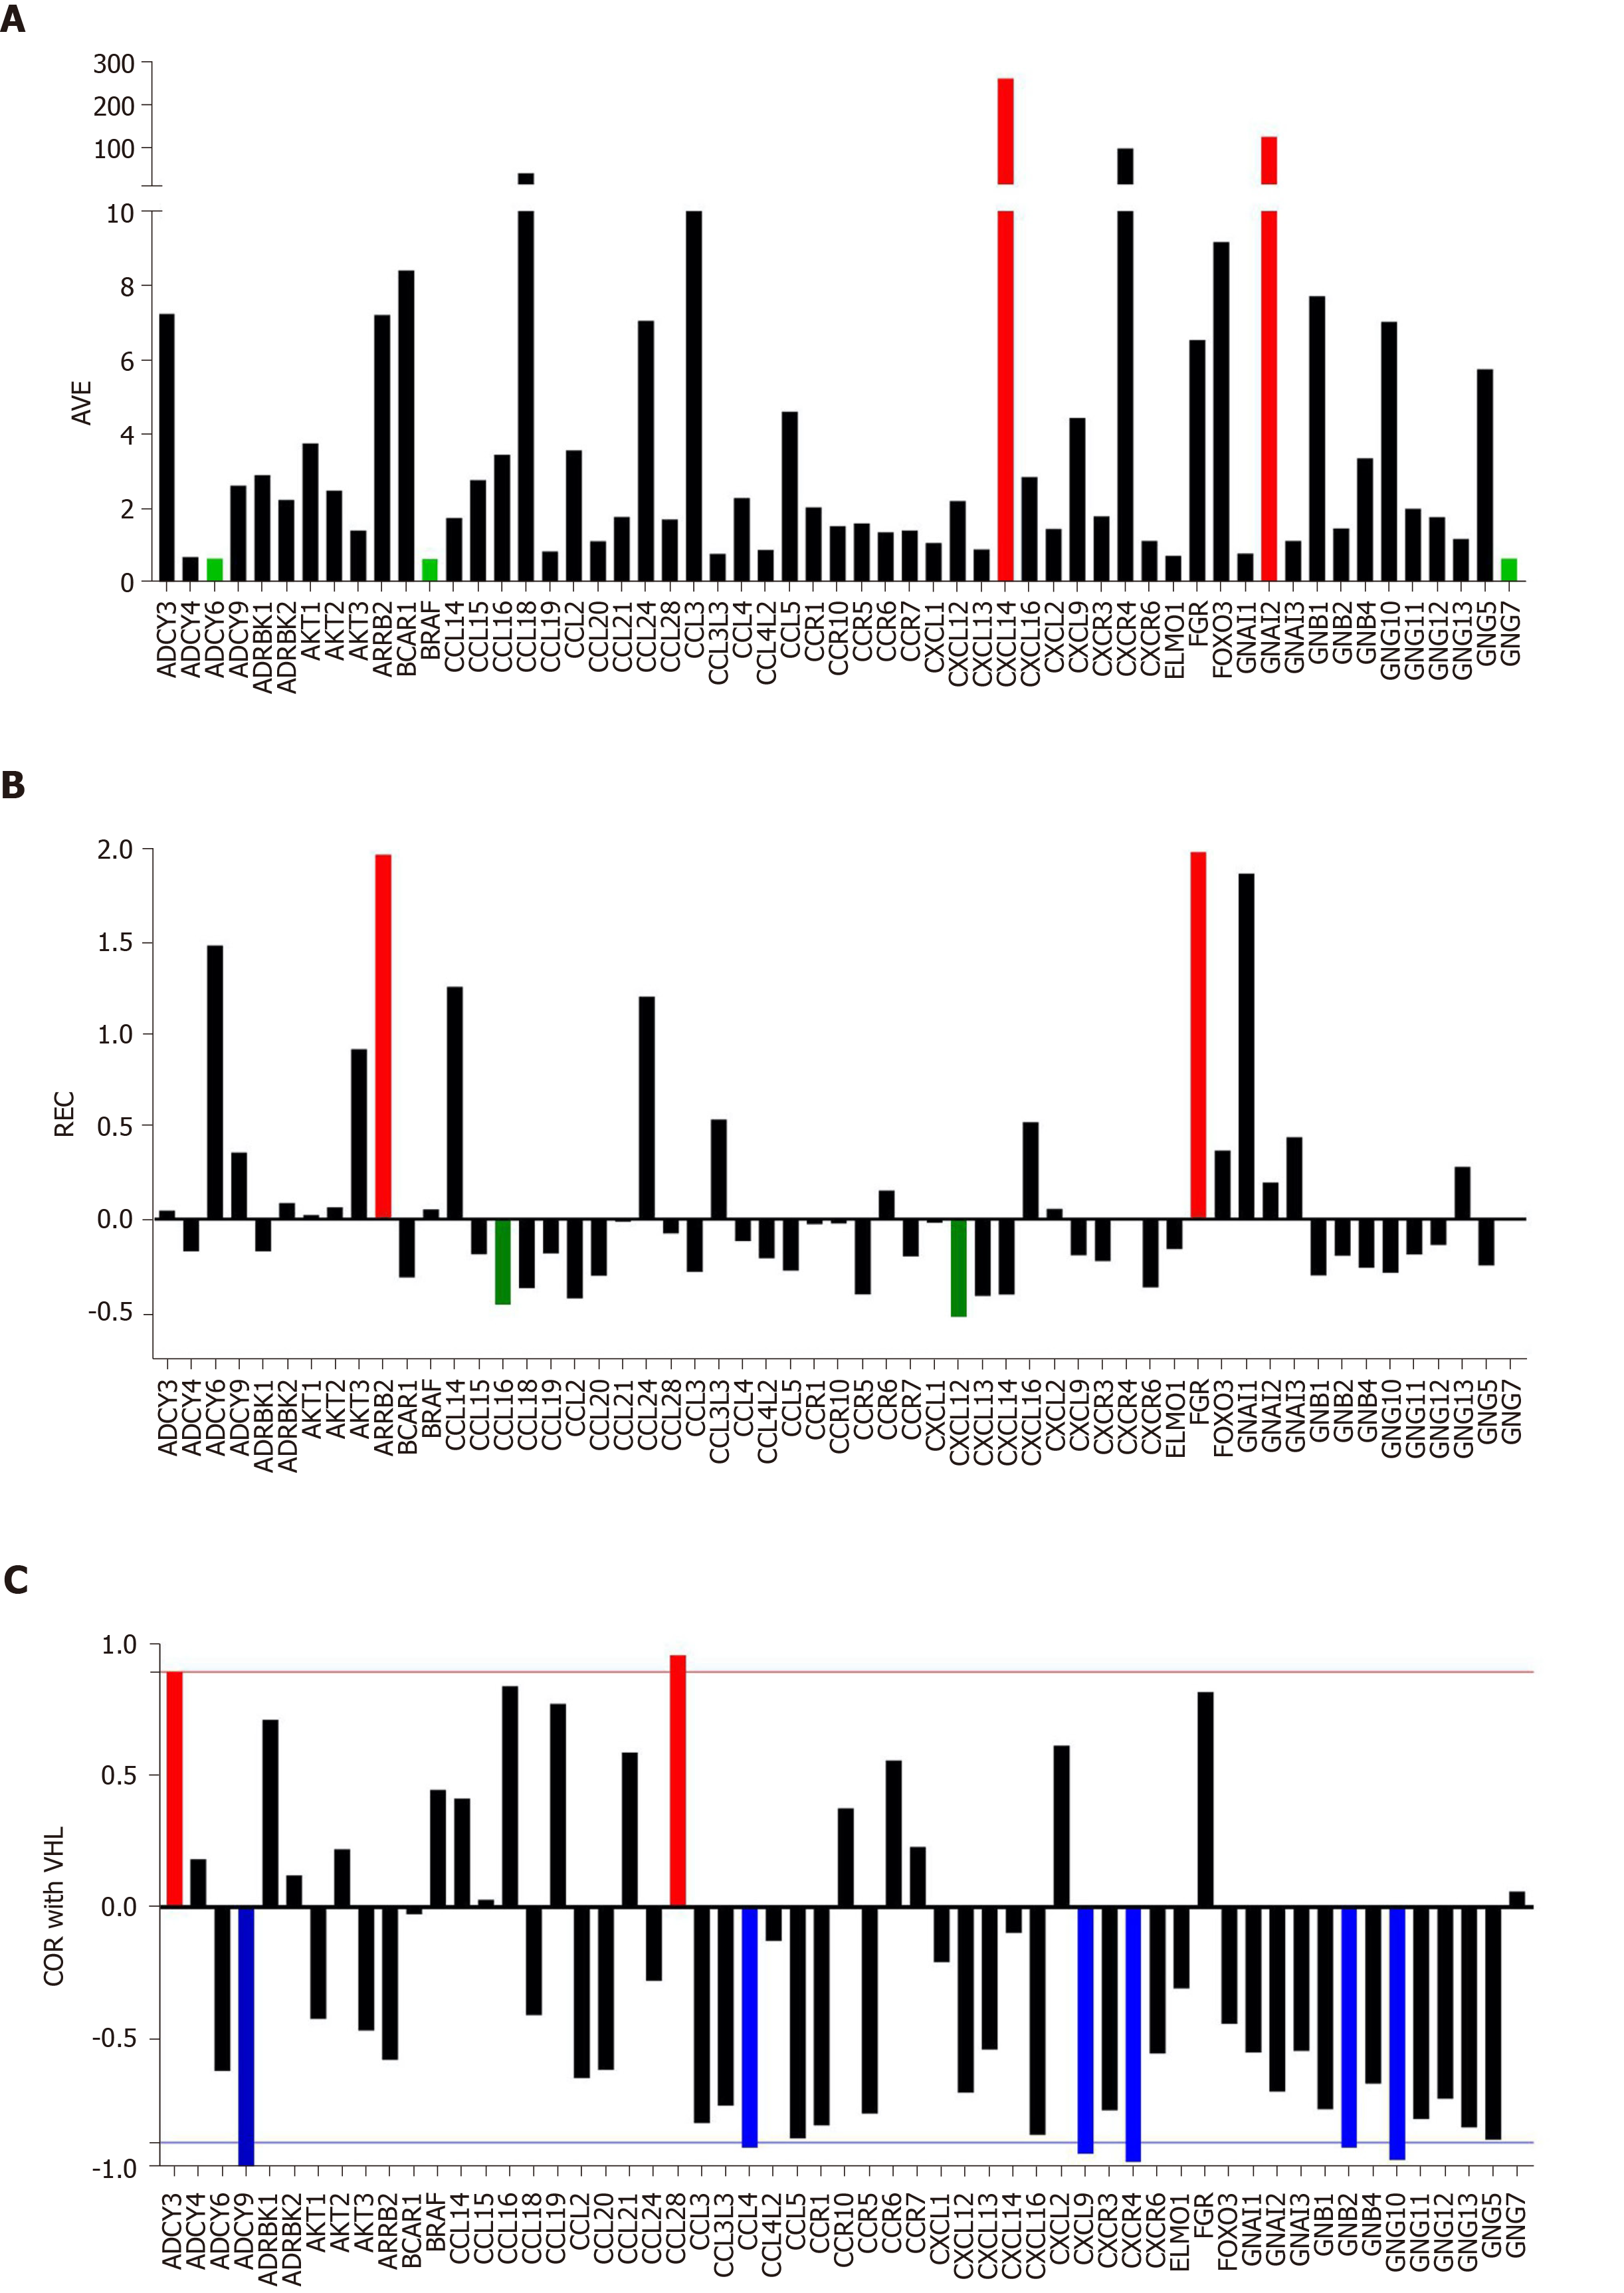
Figure 1 Individual gene quantifiers in the normal kidney tissue (NOR) from a 74-year-old clear cell renal cell carcinoma patient.
A: Average expression levels of the first alphabetically ordered 60 genes involved in the chemokine signaling. Brown columns indicate the most highly expressed genes and the blue ones the least expressed genes; B: Relative expression variability of the first alphabetically ordered 60 genes involved in the chemokine signaling. Brown columns indicate the most controlled genes and the blue ones the least controlled genes; C: Pearson product-moment correlation coefficient (COR) of VHT with the first alphabetically ordered 60 genes involved in the chemokine signaling. Brown columns indicate the significantly synergistically expressed partners of VHL and the blue ones the significantly antagonistically expressed partners. Note the independence of the three features. COR: Pearson product-moment correlation coefficient of VHT; REV: Relative expression variability.
- Citation: Iacobas DA. Powerful quantifiers for cancer transcriptomics. World J Clin Oncol 2020; 11(9): 679-704
- URL: https://www.wjgnet.com/2218-4333/full/v11/i9/679.htm
- DOI: https://dx.doi.org/10.5306/wjco.v11.i9.679


