Copyright
©The Author(s) 2020.
World J Clin Oncol. Jul 24, 2020; 11(7): 495-503
Published online Jul 24, 2020. doi: 10.5306/wjco.v11.i7.495
Published online Jul 24, 2020. doi: 10.5306/wjco.v11.i7.495
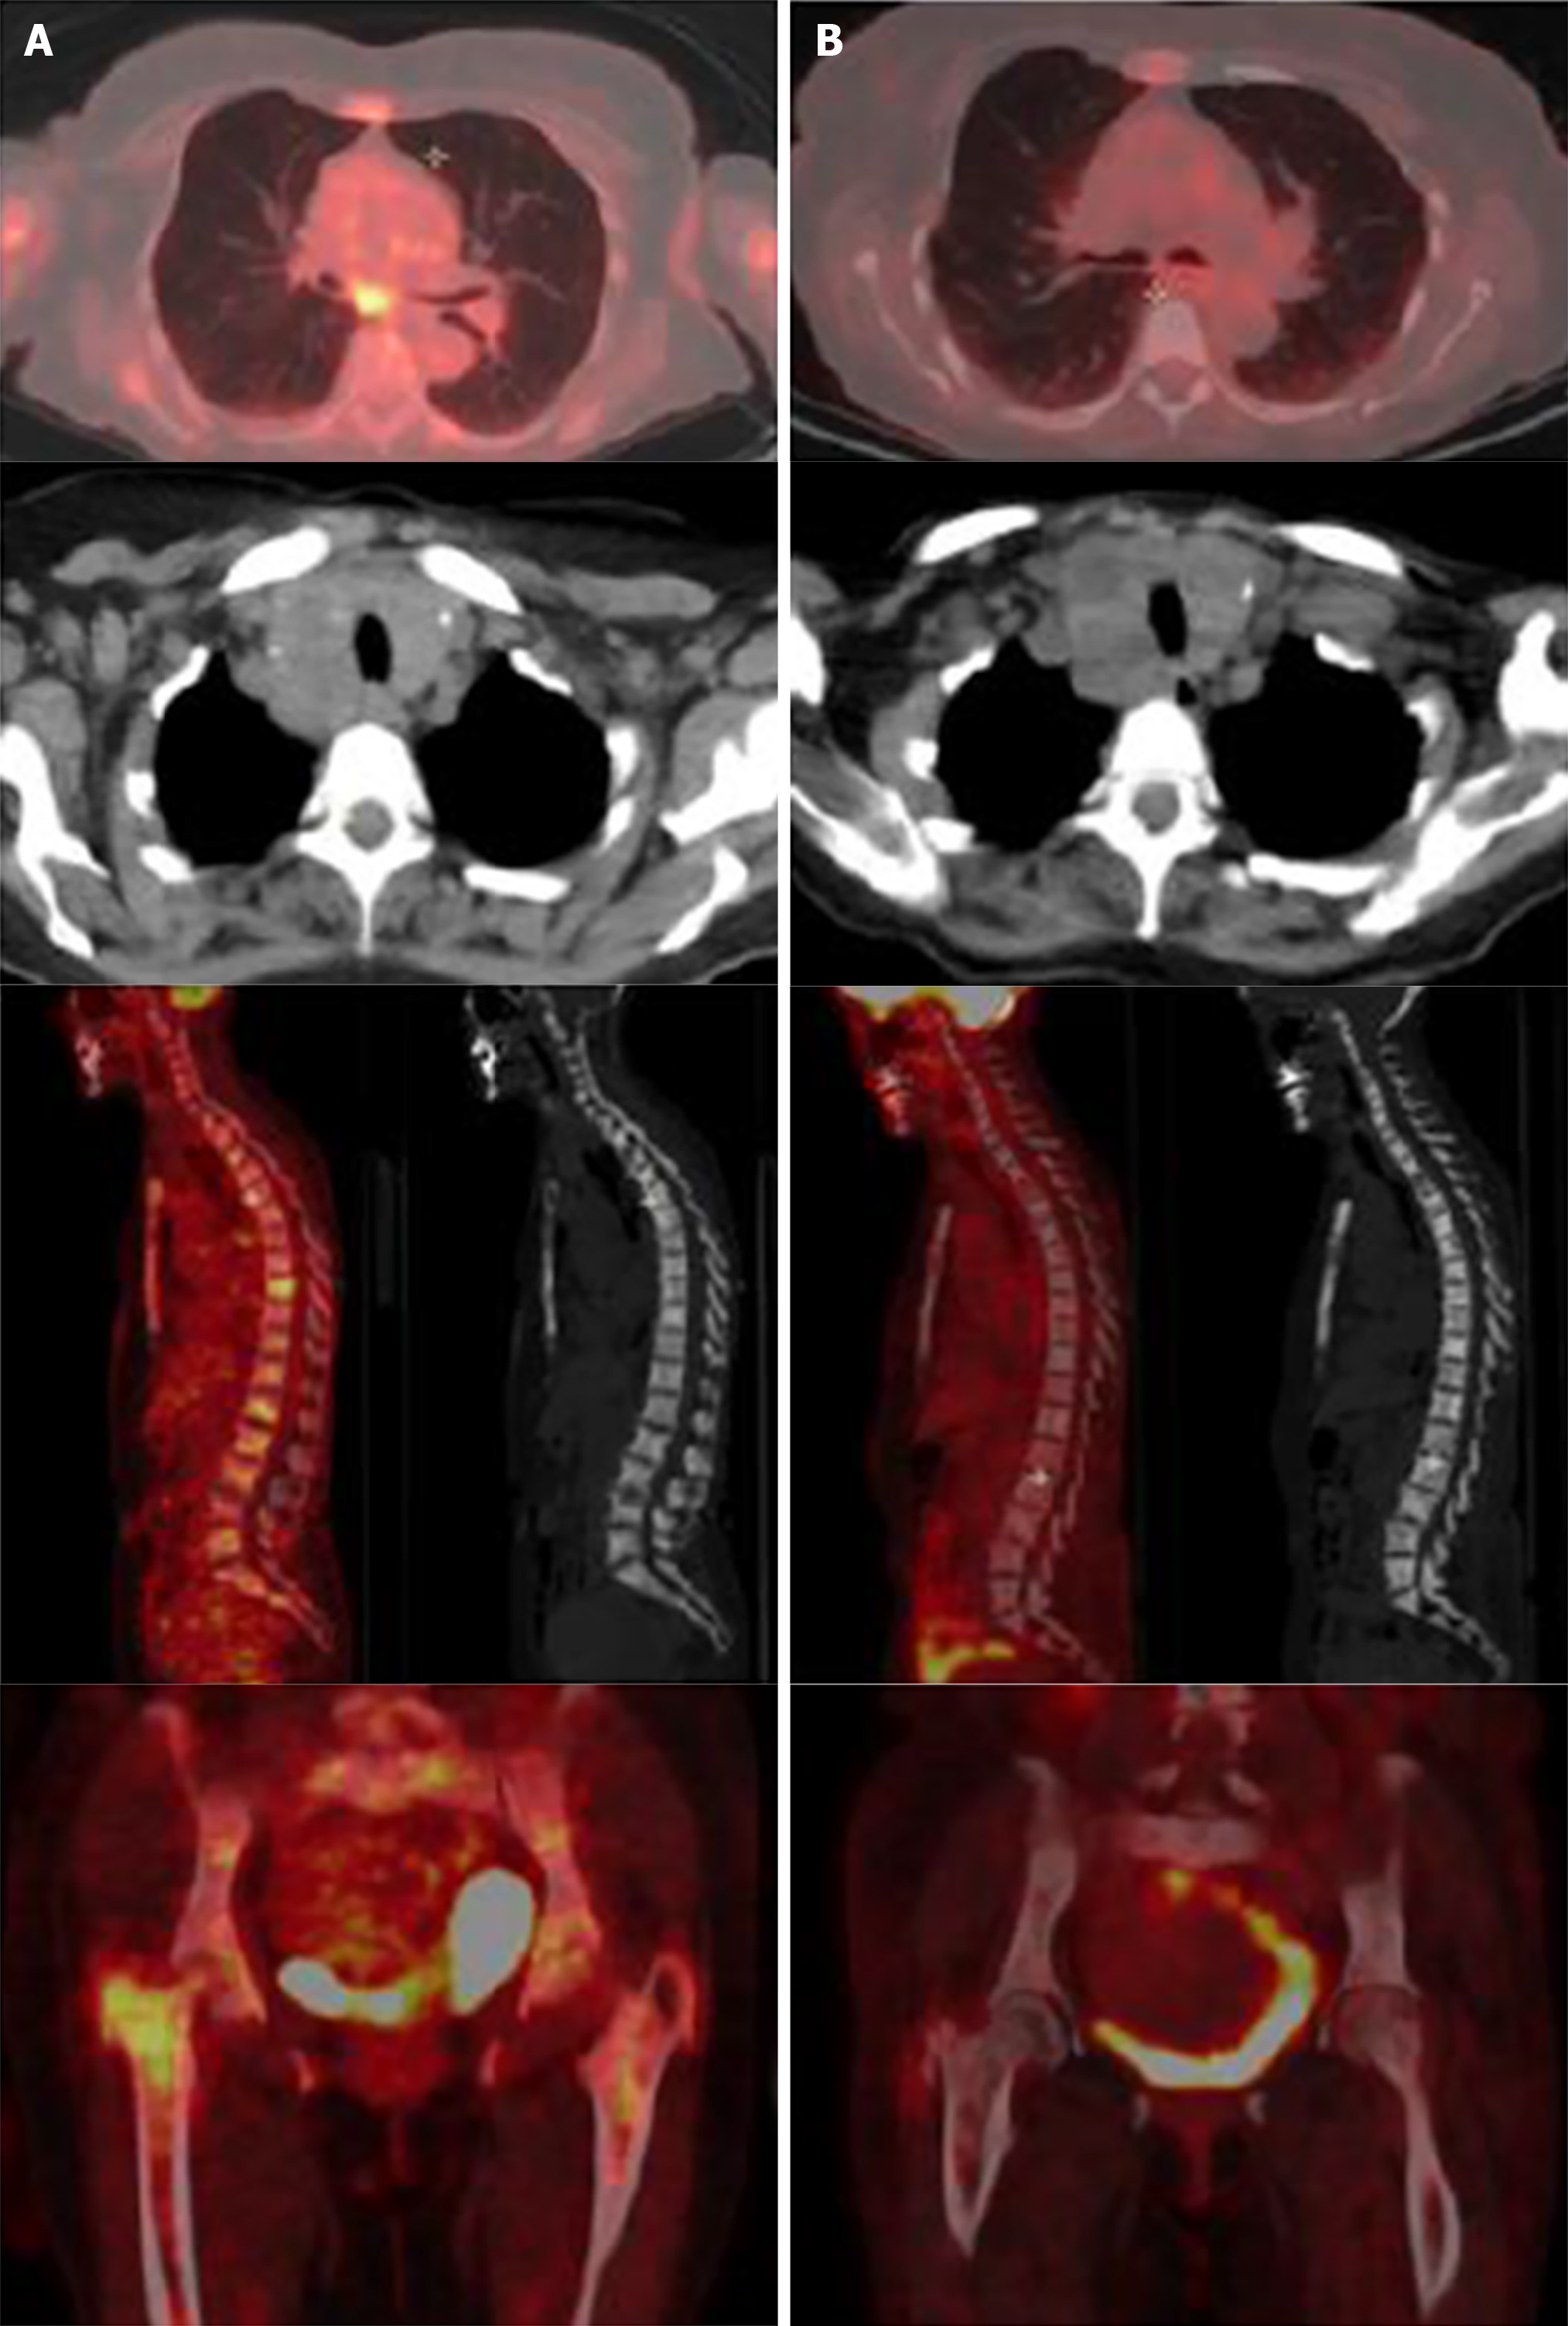
Figure 2 Comparison between baseline positron emission tomography scans (A, left) and after 4 mo of crizotinib treatment (B, right).
A: Before treatment, thyroid, pulmonary, ganglion and bone hypermetabolic spots; B: Complete metabolic response with condensing bone metastases without significant hypermetabolism.
- Citation: de Salins V, Loganadane G, Joly C, Abulizi M, Nourieh M, Boussion H, Belkacemi Y, Tournigand C, Kempf E. Complete response in anaplastic lymphoma kinase–rearranged oncocytic thyroid cancer: A case report and review of literature. World J Clin Oncol 2020; 11(7): 495-503
- URL: https://www.wjgnet.com/2218-4333/full/v11/i7/495.htm
- DOI: https://dx.doi.org/10.5306/wjco.v11.i7.495


