Copyright
©The Author(s) 2020.
World J Clin Oncol. Feb 24, 2020; 11(2): 53-73
Published online Feb 24, 2020. doi: 10.5306/wjco.v11.i2.53
Published online Feb 24, 2020. doi: 10.5306/wjco.v11.i2.53
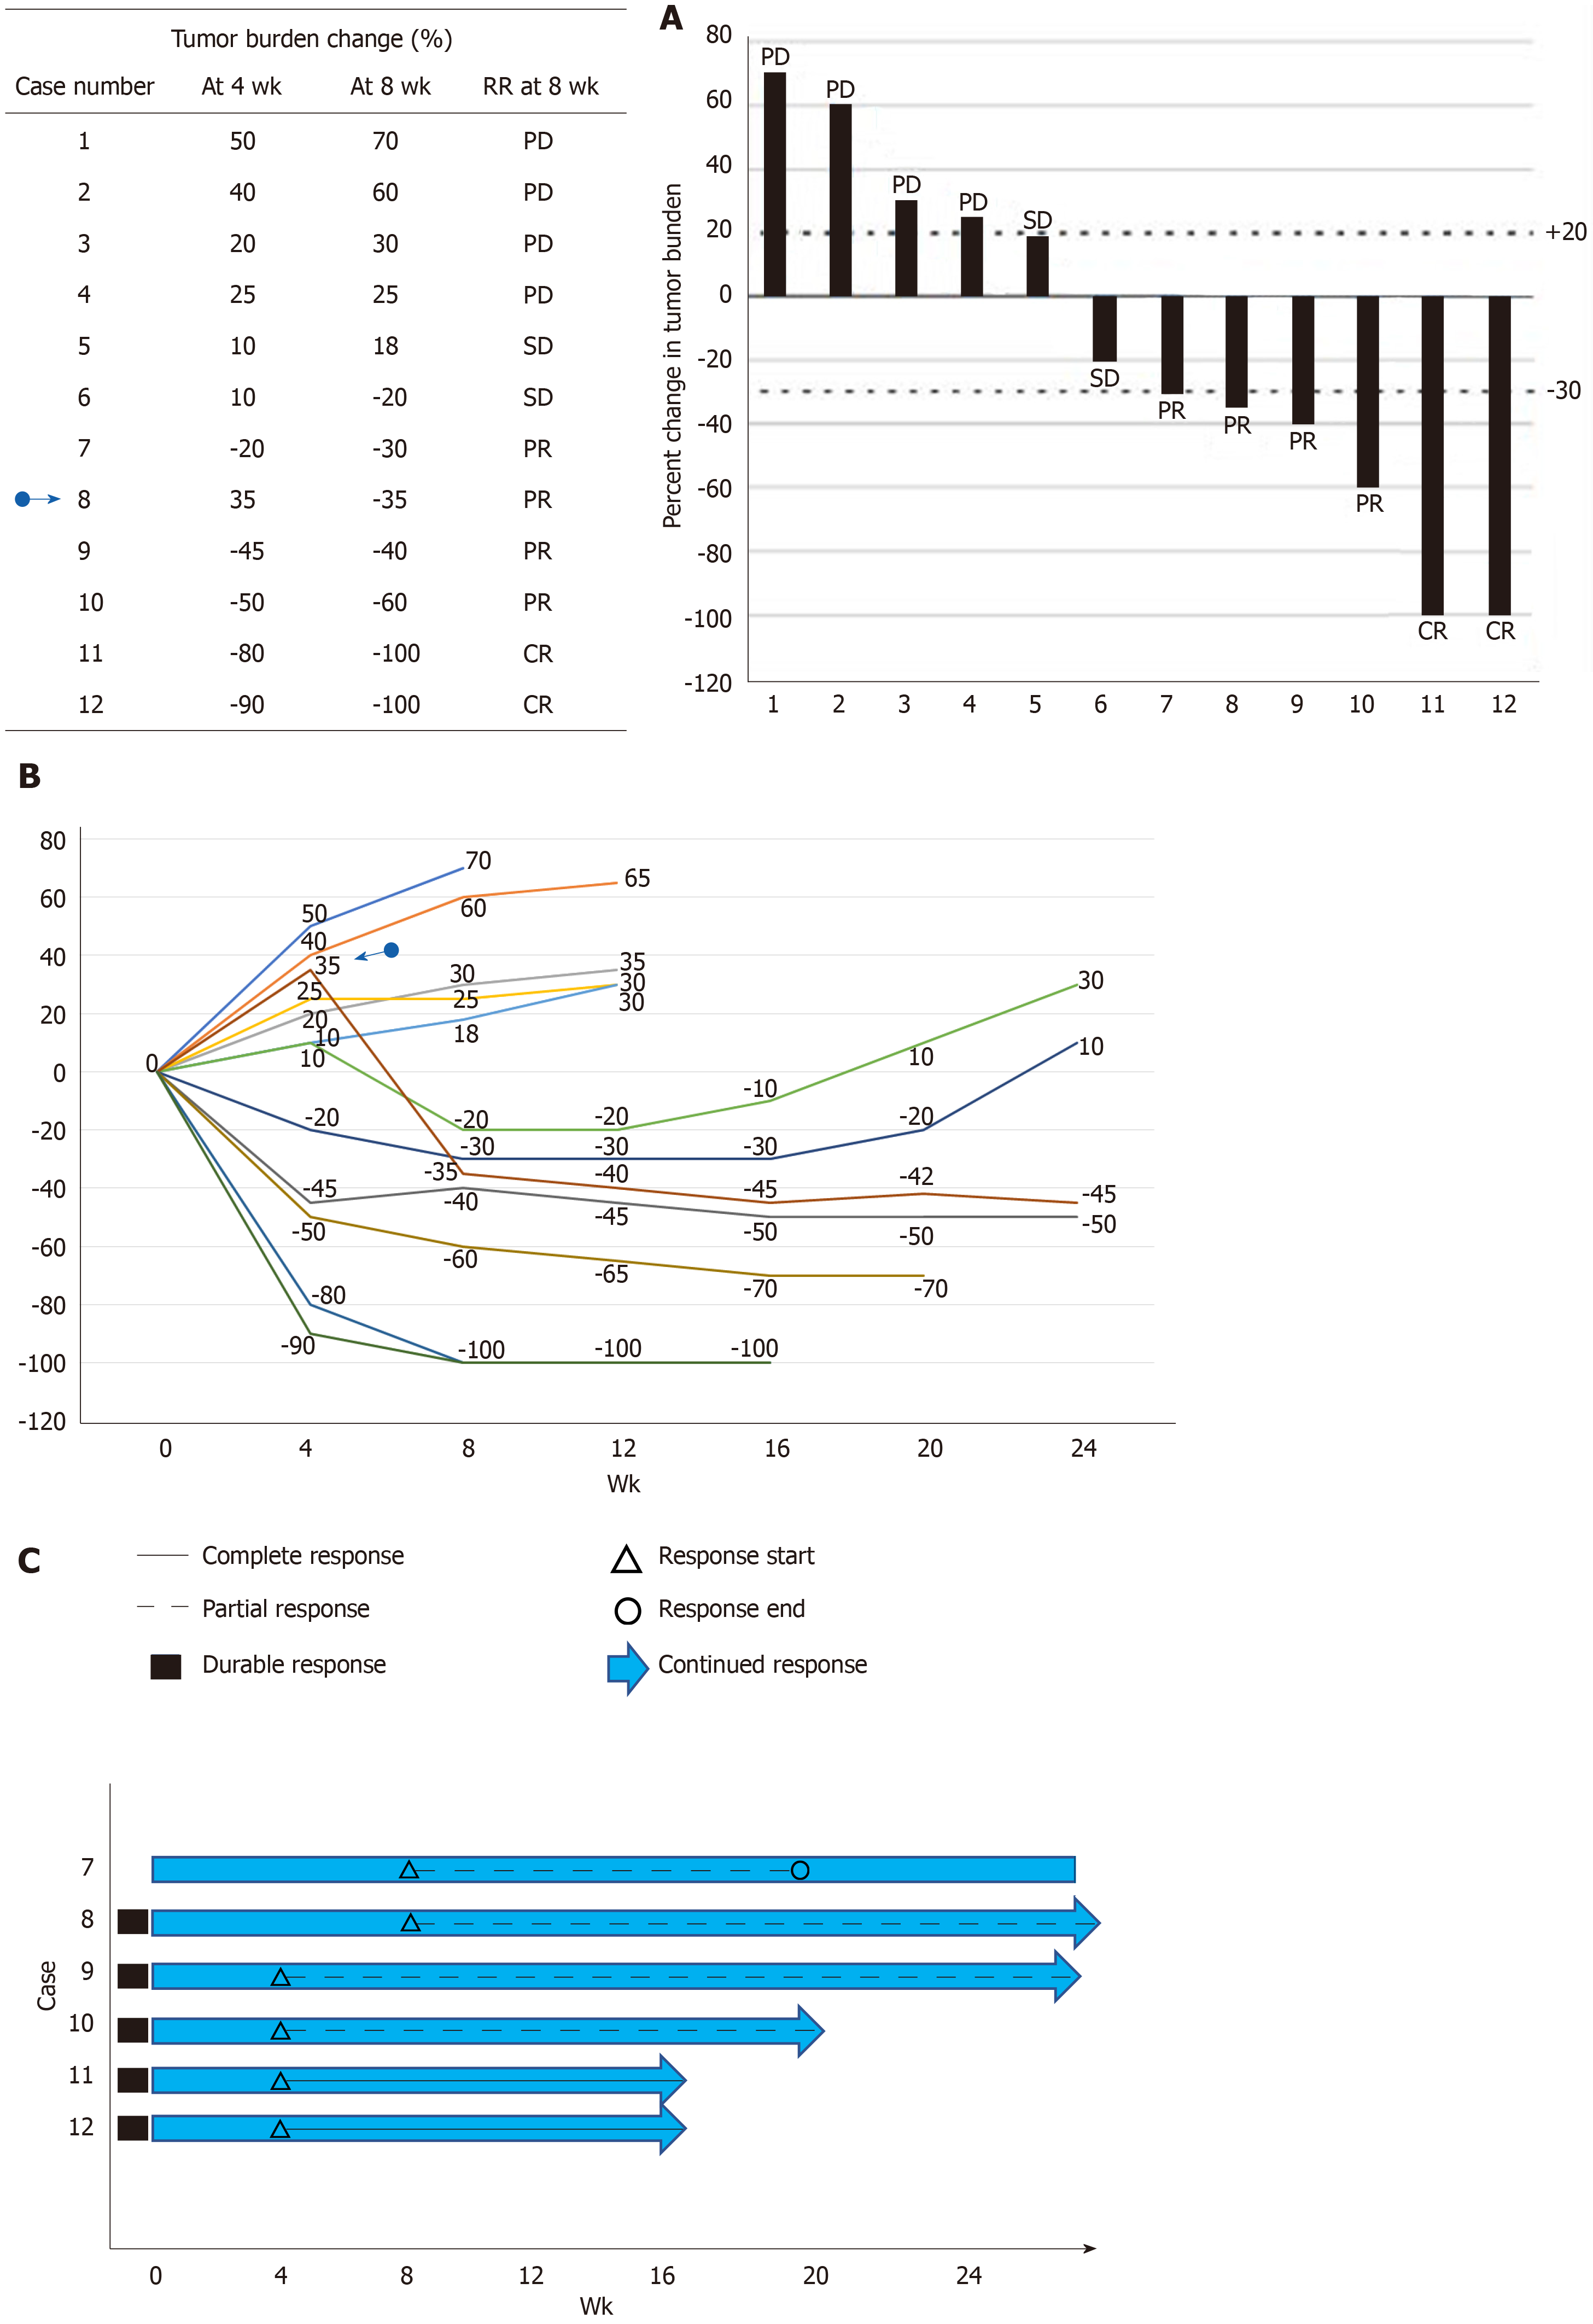
Figure 4 Waterfall, spider (spaghetti) and swimmer plot for 12 hypothetical cases.
A: Waterfall; B: Spider (spaghetti); C: Swimmer. Case 8 (blue arrow with cycle) represents pseudoprogression at the 4th week. RR: Response rate; CR: Complete response; PR: Partial response; SD: Stable disease; PD: Progressive disease.
- Citation: Aykan NF, Özatlı T. Objective response rate assessment in oncology: Current situation and future expectations. World J Clin Oncol 2020; 11(2): 53-73
- URL: https://www.wjgnet.com/2218-4333/full/v11/i2/53.htm
- DOI: https://dx.doi.org/10.5306/wjco.v11.i2.53


