Copyright
©The Author(s) 2019.
World J Clin Oncol. Dec 24, 2019; 10(12): 382-390
Published online Dec 24, 2019. doi: 10.5306/wjco.v10.i12.382
Published online Dec 24, 2019. doi: 10.5306/wjco.v10.i12.382
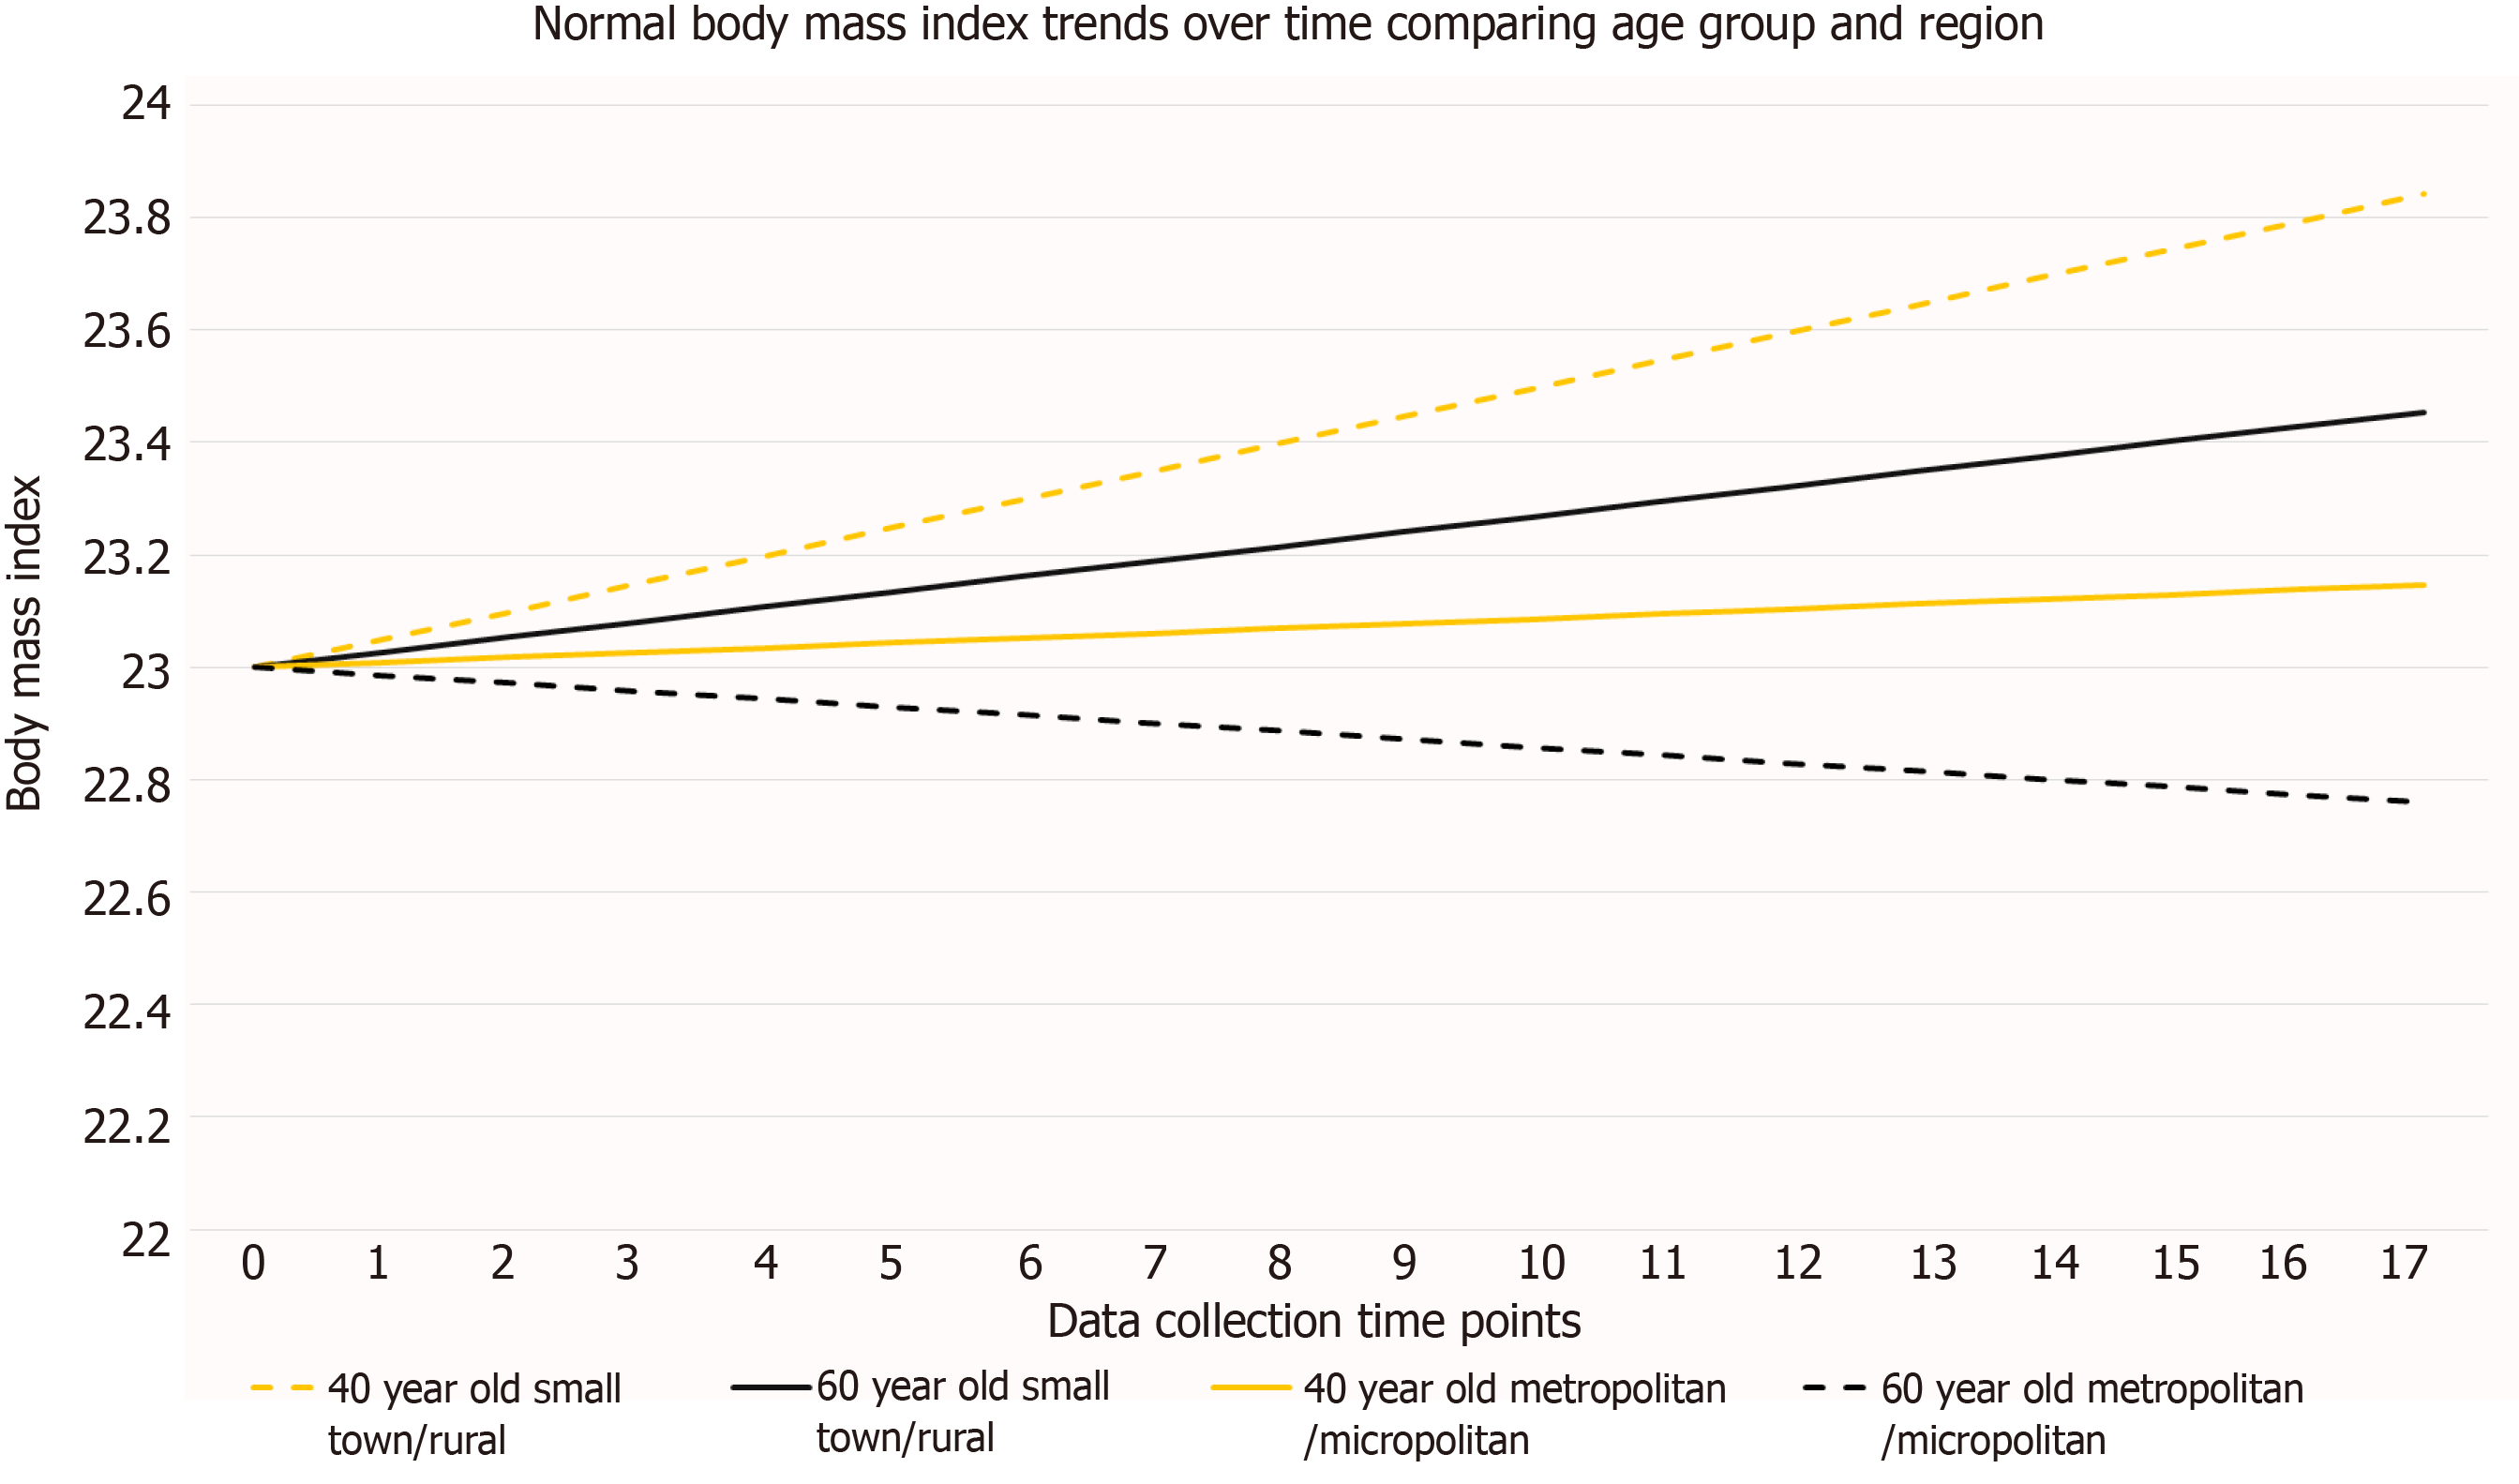
Figure 1 Normal body mass index trends over time comparing age group and region.
The estimated body mass index (BMI) trajectory for four women whose BMI falls in the normal range are shown in this graph. They all started with a BMI of 23, a weight of 134 lbs and height of 5’4. The model is designed so the reference groups were ≥ 55 years old and a living in a small town or rural region. A woman falling into these two groups is represented by the solid black line (average expected gain in BMI of 0.45kg/m2).
- Citation: Anbari AB, Deroche CB, Armer JM. Body mass index trends and quality of life from breast cancer diagnosis through seven years’ survivorship. World J Clin Oncol 2019; 10(12): 382-390
- URL: https://www.wjgnet.com/2218-4333/full/v10/i12/382.htm
- DOI: https://dx.doi.org/10.5306/wjco.v10.i12.382


