Copyright
©The Author(s) 2017.
World J Gastrointest Pharmacol Ther. May 6, 2017; 8(2): 127-130
Published online May 6, 2017. doi: 10.4292/wjgpt.v8.i2.127
Published online May 6, 2017. doi: 10.4292/wjgpt.v8.i2.127
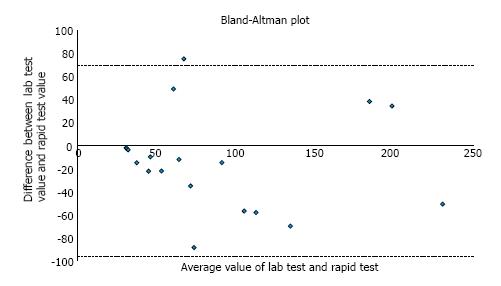
Figure 1 Bland-Altman plot for calprotectin values ≤ 250 μg/g.
Pitman’s test showed r = 0.072, with the value close to zero indicating good concordance between the two tests (P = 0.779).
- Citation: Rodriguez A, Yokomizo L, Christofferson M, Barnes D, Khavari N, Park KT. Correlation of rapid point-of-care vs send-out fecal calprotectin monitoring in pediatric inflammatory bowel disease. World J Gastrointest Pharmacol Ther 2017; 8(2): 127-130
- URL: https://www.wjgnet.com/2150-5349/full/v8/i2/127.htm
- DOI: https://dx.doi.org/10.4292/wjgpt.v8.i2.127


