Copyright
©The Author(s) 2016.
World J Gastrointest Pharmacol Ther. May 6, 2016; 7(2): 242-253
Published online May 6, 2016. doi: 10.4292/wjgpt.v7.i2.242
Published online May 6, 2016. doi: 10.4292/wjgpt.v7.i2.242
Figure 1 Administration of dextran sulfate sodium to induce colitis.
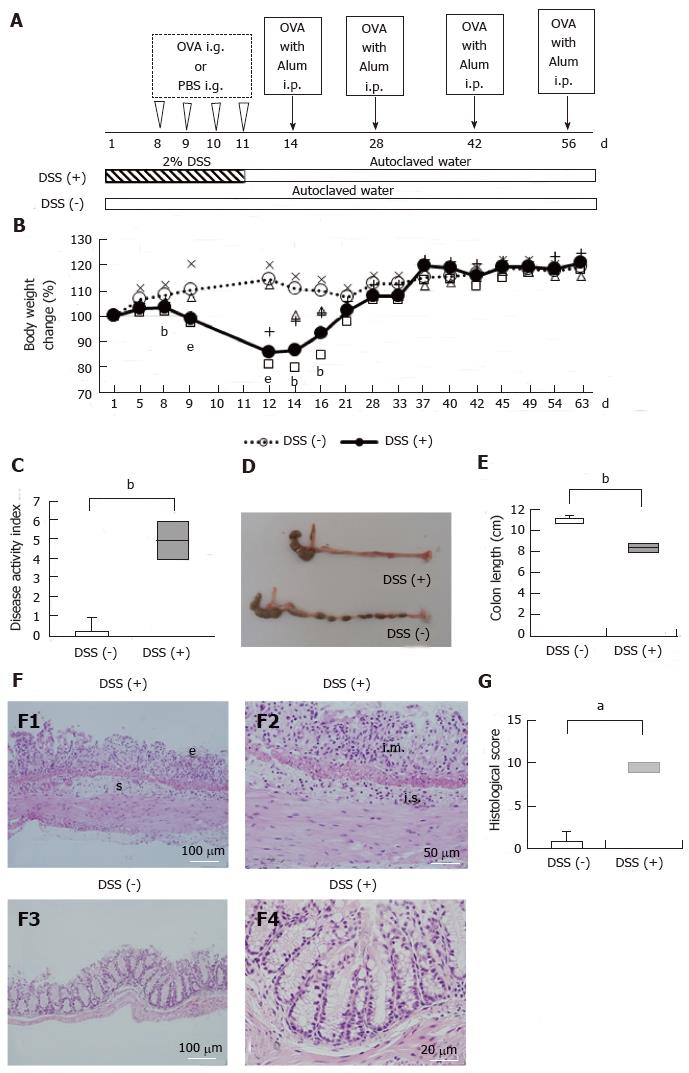
A: Experimental design for the induction of oral tolerance and dextran sulfate sodium (DSS) colitis; B: Percent changes in the body weights of mice that received 2% DSS [DSS (+) mice] and mice that received autoclaved water (control mice). The body weights of the DSS (+) mice (median: Closed circles, first quartile: Plus, third quartile: Open box) were significantly lower than those of the control mice (median: Open circles, first quartile: X-mark, third quartile: Open triangle) from day 8 to day 16; C: Disease activity index (DAI) for the DSS (+) mice and the control mice on day 12. The DAI of the DSS (+) mice (closed bar) was significantly increased compared to that of the control mice (open bar); D: A representative image of colons collected from the DSS (+) mice and the control mice on day 8. The median colon length in the DSS (+) mice was shorter than that in the control mice; E: Colon lengths for the DSS (+) mice and the control mice on day 8. On day 8, the median colon length for the DSS (+) mice (closed bar) was significantly shorter than that for the control mice (open bar); F: Representative hematoxylin and eosin staining of colon sections. On day 8, the colons were removed, fixed in 10% buffered formalin, embedded in paraffin, cut into sections, and stained with hematoxylin and eosin. The DSS (+) mice showed pathological changes characterized by epithelial defects, submucosal edema (F1) and inflammatory cell infiltration in the mucosal layer and submucosal layer (F2). The control mice showed minimal chronic inflammatory cells in the lamina propria with regularly spaced crypts and did not show epithelial defects or submucosal edema (F3, F4); G: Histological scores for the DSS (+) mice and the control mice on day 8. The DSS (+) mice (closed bar) had significantly higher histological scores than the control mice (open bar). The data are shown as the median and interquartile range of three to six mice per group. aP < 0.05, bP < 0.01, eP < 0.001. e: Epithelial; s: Submucosal edema; i.m.: Inflammatory cell infiltration in the mucosal layer; i.s.: Inflammatory cell infiltration in the submucosal layer.
- Citation: Ino S, Kohda C, Takeshima K, Ishikawa H, Norose T, Yamochi T, Takimoto M, Takahashi H, Tanaka K. Oral tolerance is inducible during active dextran sulfate sodium-induced colitis. World J Gastrointest Pharmacol Ther 2016; 7(2): 242-253
- URL: https://www.wjgnet.com/2150-5349/full/v7/i2/242.htm
- DOI: https://dx.doi.org/10.4292/wjgpt.v7.i2.242


