Copyright
©The Author(s) 2015.
World J Gastrointest Pharmacol Ther. Nov 6, 2015; 6(4): 238-243
Published online Nov 6, 2015. doi: 10.4292/wjgpt.v6.i4.238
Published online Nov 6, 2015. doi: 10.4292/wjgpt.v6.i4.238
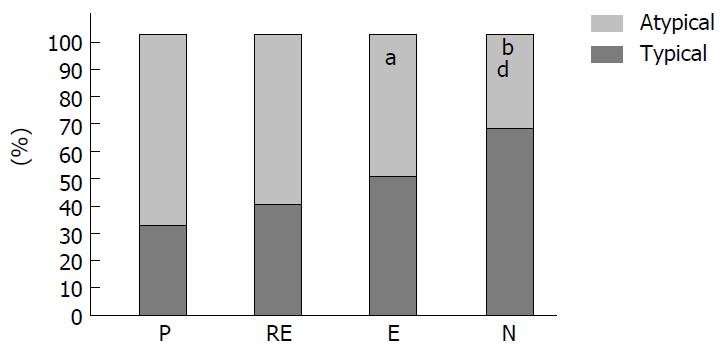
Figure 3 Percentage distribution of typical (dark grey) and atypical (light grey) symptoms in our four different groups of patients.
From left to right, the bars indicate the group of patients Helicobacter pylori (H. pylori)-positive (P), eradicated less than 6 mo before pH monitoring (RE), eradicated more than 6 mo earlier (E), and H. pylori-negative (N). As shown, there is a progressive change in the percentage of symptoms related to the pattern of H. pylori infection. dP < 0.001 between N and P; bP < 0.01 between N and RE; aP < 0.05 between E and P.
-
Citation: Grossi L, Ciccaglione AF, Marzio L. Typical and atypical symptoms of gastro esophageal reflux disease: Does
Helicobacter pylori infection matter? World J Gastrointest Pharmacol Ther 2015; 6(4): 238-243 - URL: https://www.wjgnet.com/2150-5349/full/v6/i4/238.htm
- DOI: https://dx.doi.org/10.4292/wjgpt.v6.i4.238


