Copyright
©The Author(s) 2015.
World J Gastrointest Pharmacol Ther. Aug 6, 2015; 6(3): 73-83
Published online Aug 6, 2015. doi: 10.4292/wjgpt.v6.i3.73
Published online Aug 6, 2015. doi: 10.4292/wjgpt.v6.i3.73
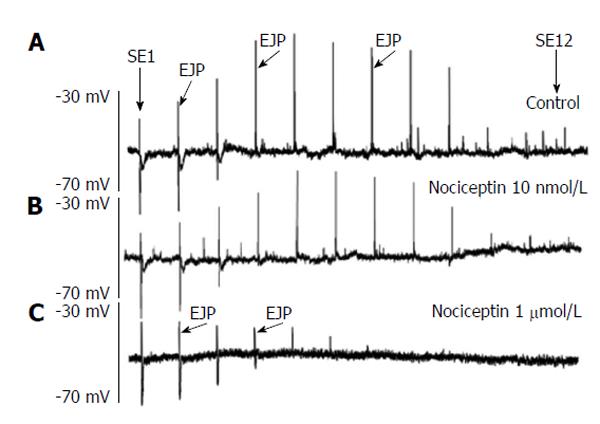
Figure 6 Effect of nociceptin (1 nmol/L, 1 μmol/L) on the spatial distribution of the excitatory junction potentials.
Tracing A shows the spatial distribution of the excitatory junction potentials (EJP) recorded in smooth muscle cells. Stimulation site (SE)1 corresponds to stimulation nearby the recording site, whereas SE12 represents stimulation located 20 mm in anal direction. Thus the original recording shows the spatial distribution of ascending electrophysiological responses following anal stimulation recorded in 1.67 mm intervals. Tracings B and C show the effect of increasing concentrations of nociceptin (10 nmol/L and 1 μm) on the spatial distribution of junction potentials. Note the marked reduction of EJP in a concentration-dependent fashion and the shift of the maximal distance over which an EJP can be recorded.
- Citation: Sibaev A, Fichna J, Saur D, Yuece B, Timmermans JP, Storr M. Nociceptin effect on intestinal motility depends on opioid-receptor like-1 receptors and nitric oxide synthase co-localization. World J Gastrointest Pharmacol Ther 2015; 6(3): 73-83
- URL: https://www.wjgnet.com/2150-5349/full/v6/i3/73.htm
- DOI: https://dx.doi.org/10.4292/wjgpt.v6.i3.73


