Copyright
©The Author(s) 2019.
World J Gastrointest Pharmacol Ther. Jul 18, 2019; 10(3): 57-66
Published online Jul 18, 2019. doi: 10.4292/wjgpt.v10.i3.57
Published online Jul 18, 2019. doi: 10.4292/wjgpt.v10.i3.57
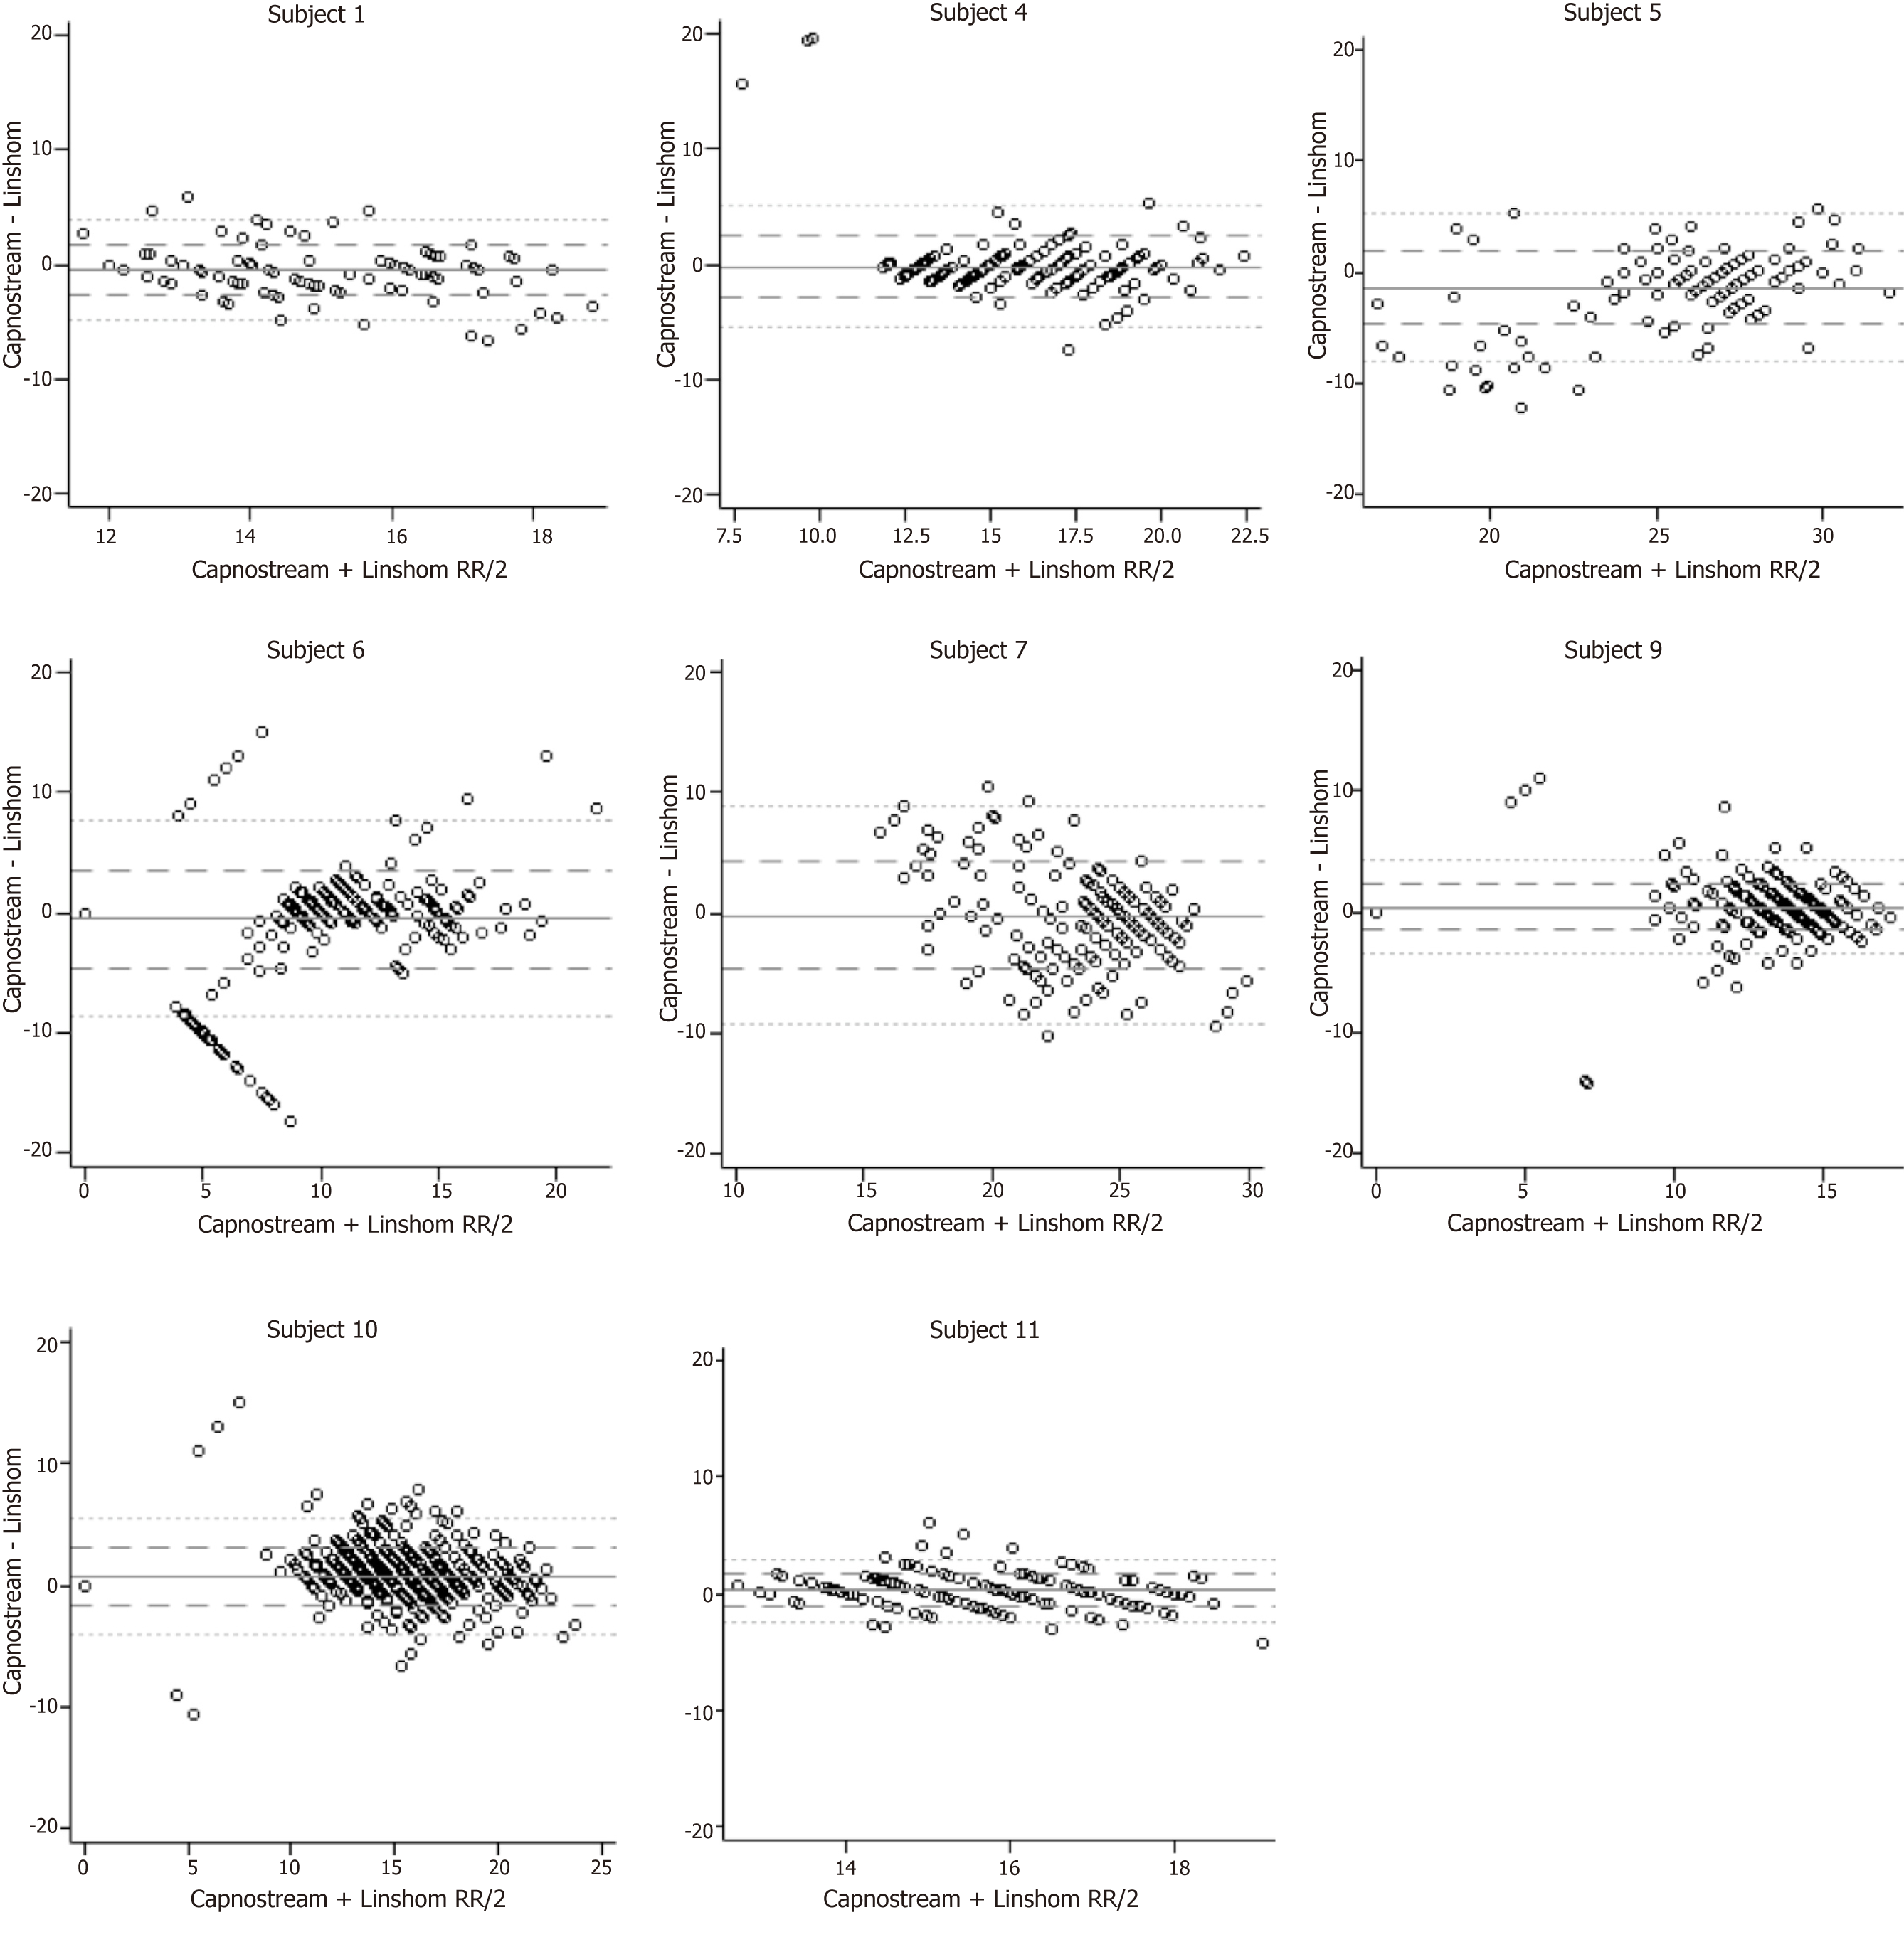
Figure 2 Bland-Altman Plots.
The difference in results (y-axis) is plotted against the average magnitude of the result (x-axis). A difference of 0 indicates equivalent results. The dark horizontal reference line is the mean difference in results. The dashed and dotted lines are the first and second standard deviation of the difference. RR: Respiratory rate.
- Citation: Wadhwa V, Gonzalez AJ, Selema K, Feldman R, Lopez R, Vargo JJ. Novel device for monitoring respiratory rate during endoscopy-A thermodynamic sensor. World J Gastrointest Pharmacol Ther 2019; 10(3): 57-66
- URL: https://www.wjgnet.com/2150-5349/full/v10/i3/57.htm
- DOI: https://dx.doi.org/10.4292/wjgpt.v10.i3.57


