Copyright
©The Author(s) 2018.
World J Gastrointest Pathophysiol. Sep 29, 2018; 9(2): 47-58
Published online Sep 29, 2018. doi: 10.4291/wjgp.v9.i2.47
Published online Sep 29, 2018. doi: 10.4291/wjgp.v9.i2.47
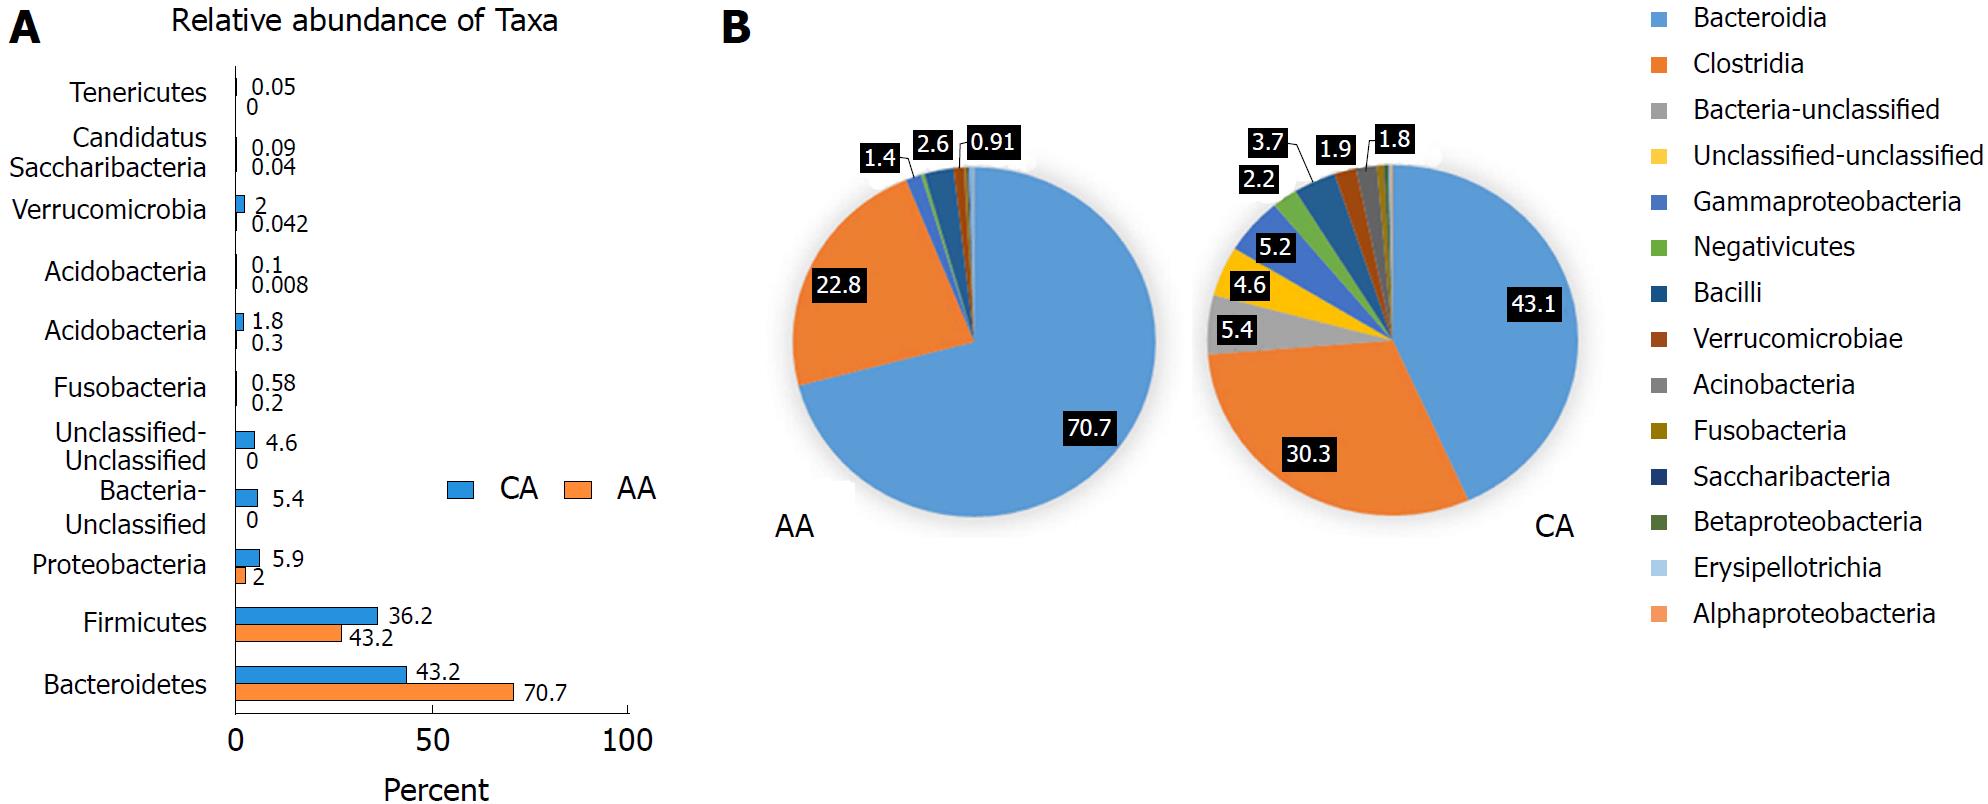
Figure 2 Microbial composition of each group at the phylum and class levels.
A: Bar chart shows the relative abundance of phylum; B: Pie chart show the proportion of predominant different classes of microbial community in African Americans and Caucasian Americans. In order to get more comprehensive and accurate taxonomies, multiple databases, Ribosomal Database Project classifier, Greengenes and NCBI 16S Microbial were used for analysis of plot bars and pie charts.
- Citation: Farhana L, Antaki F, Murshed F, Mahmud H, Judd SL, Nangia-Makker P, Levi E, Yu Y, Majumdar AP. Gut microbiome profiling and colorectal cancer in African Americans and Caucasian Americans. World J Gastrointest Pathophysiol 2018; 9(2): 47-58
- URL: https://www.wjgnet.com/2150-5330/full/v9/i2/47.htm
- DOI: https://dx.doi.org/10.4291/wjgp.v9.i2.47


