Copyright
©The Author(s) 2018.
World J Gastrointest Pathophysiol. Sep 29, 2018; 9(2): 47-58
Published online Sep 29, 2018. doi: 10.4291/wjgp.v9.i2.47
Published online Sep 29, 2018. doi: 10.4291/wjgp.v9.i2.47
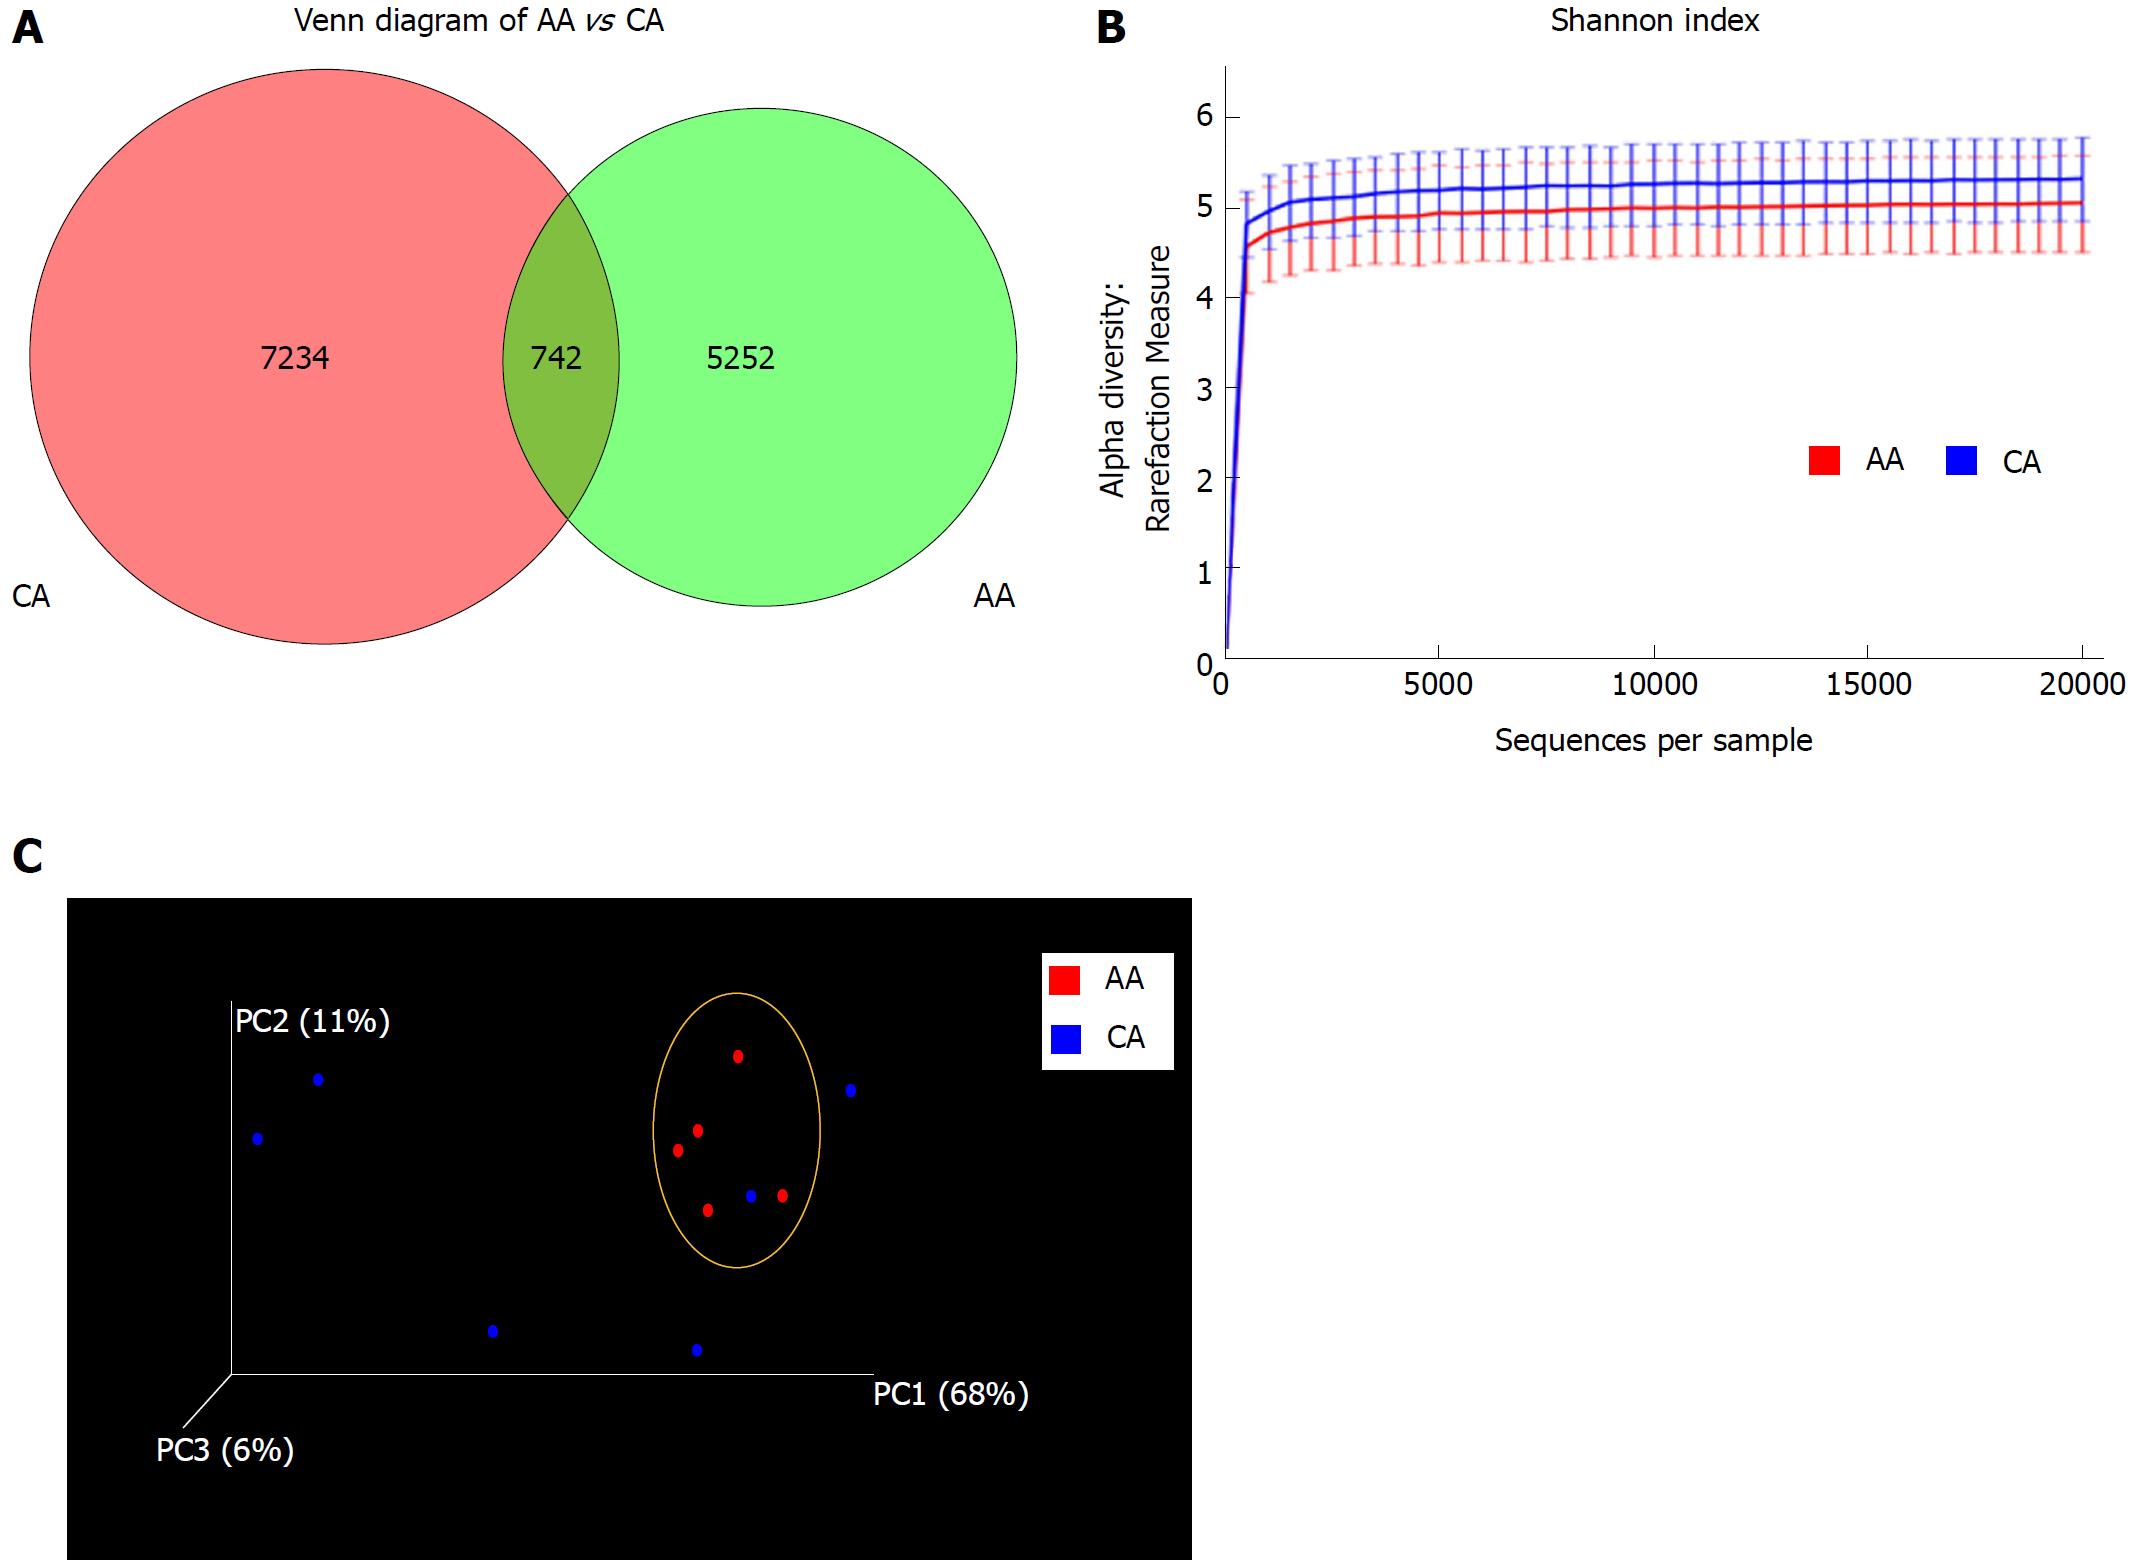
Figure 1 Microbial diversity in colonic effluent from African Americans and Caucasian Americans.
A: Venn diagram showing the unique Operational taxonomic units (OTUs) in different subsets of African American (AA) and Caucasian Americans (CA) including overlap community; B: Rarefaction curves showing the species richness from the average number of OTUs for AA and CA (alpha diversity); C: Principal coordinates analysis for beta diversity showing the very dissimilar individual in the CA group while closely similar to the group indicated by the yellow circle. CD-HIT and R software were used for BIOM format OTU clustering and OTU statistics. For measurement of alpha diversity of observed species, QIIME software and Shannon index were used and the emperor tool generated the PCoA plot.
- Citation: Farhana L, Antaki F, Murshed F, Mahmud H, Judd SL, Nangia-Makker P, Levi E, Yu Y, Majumdar AP. Gut microbiome profiling and colorectal cancer in African Americans and Caucasian Americans. World J Gastrointest Pathophysiol 2018; 9(2): 47-58
- URL: https://www.wjgnet.com/2150-5330/full/v9/i2/47.htm
- DOI: https://dx.doi.org/10.4291/wjgp.v9.i2.47


