Copyright
©The Author(s) 2016.
World J Gastrointest Pathophysiol. Feb 15, 2016; 7(1): 72-85
Published online Feb 15, 2016. doi: 10.4291/wjgp.v7.i1.72
Published online Feb 15, 2016. doi: 10.4291/wjgp.v7.i1.72
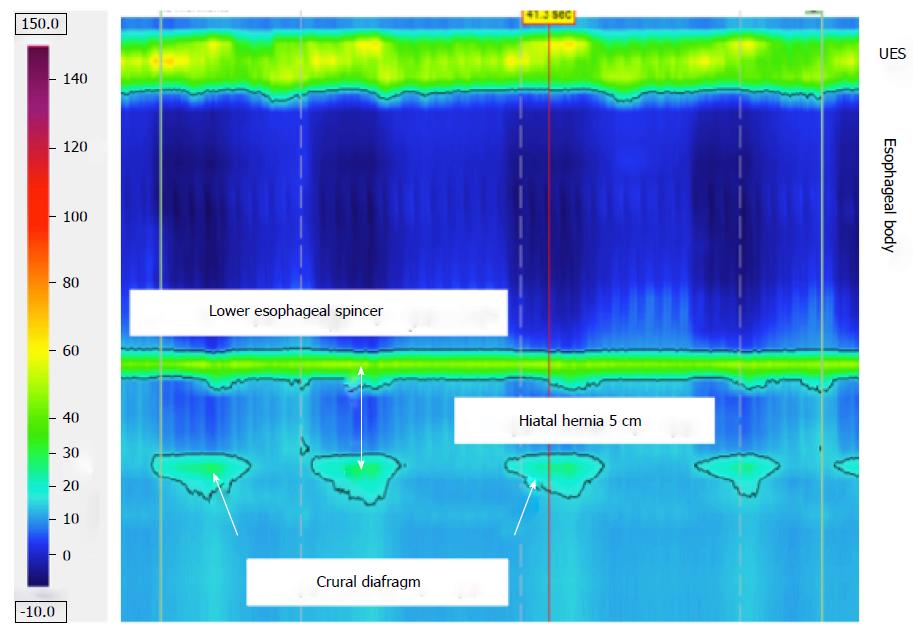
Figure 2 High resolution pressure topography at 30 s resting pressure calculation.
In the picture, both the upper and lower esophageal sphincters and the crural diaphragm are well represented. This picture represents a large hiatal hernia (5 cm). UES: Upper esophageal sphincter.
- Citation: de Bortoli N, Martinucci I, Bertani L, Russo S, Franchi R, Furnari M, Tolone S, Bodini G, Bolognesi V, Bellini M, Savarino V, Marchi S, Savarino EV. Esophageal testing: What we have so far. World J Gastrointest Pathophysiol 2016; 7(1): 72-85
- URL: https://www.wjgnet.com/2150-5330/full/v7/i1/72.htm
- DOI: https://dx.doi.org/10.4291/wjgp.v7.i1.72


