Copyright
©The Author(s) 2016.
World J Gastrointest Pathophysiol. Feb 15, 2016; 7(1): 138-149
Published online Feb 15, 2016. doi: 10.4291/wjgp.v7.i1.138
Published online Feb 15, 2016. doi: 10.4291/wjgp.v7.i1.138
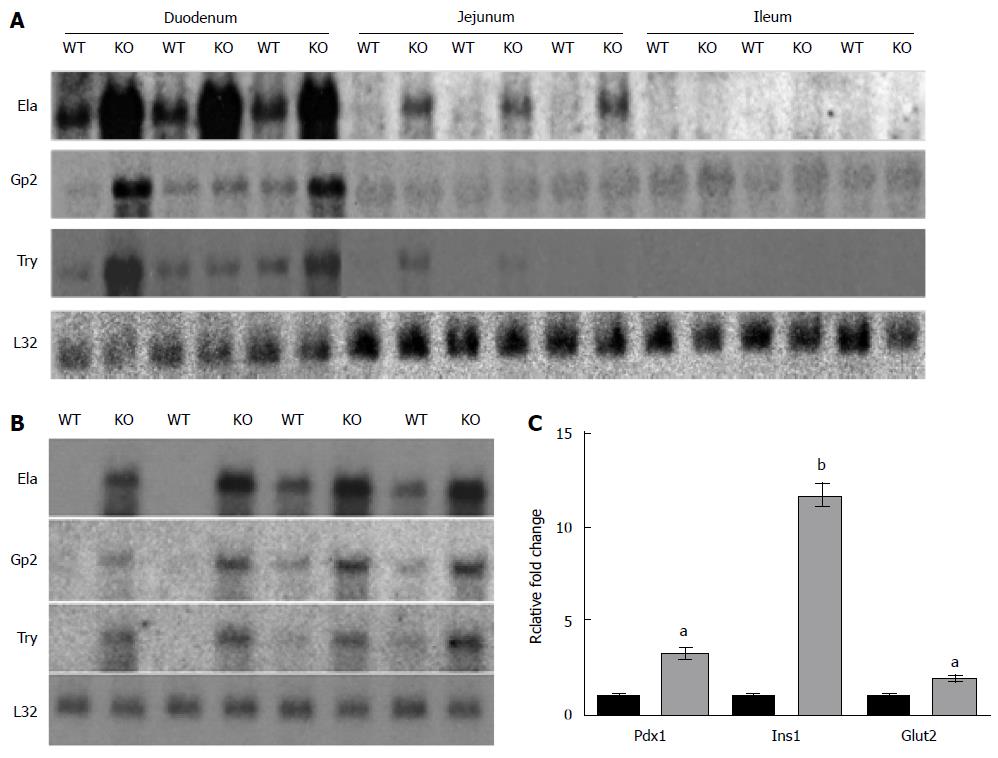
Figure 1 Northern blot and polymerase chain reaction analysis of duodenal gene expression.
A: Northern blots show upregulation of Ela, Gp2, and Try primarily in the duodenum of Nkcc1-/- (KO) mice relative to WT; n = 3 WT and 3 KO for each segment; B: Duodenal tissue from a separate cohort of mice confirms upregulation of elastase (4.7-fold, P = 0.002), glycoprotein 2 (3.5-fold, P = 0.02) and trypsin (6.0-fold, P = 0.002); n = 4 WT and 4 KO; C: Quantitative real-time polymerase chain reaction analysis of dx1, Ins1, and Glut2 shows increased expression of these genes in Nkcc1-/- duodenum. Expression levels were normalized using the L32 ribosomal subunit mRNA; n = 4 WT (black bars) and 4 KO (grey bars). aP < 0.01 vs WT, bP < 0.002 vs WT. Gp2: Glycoprotein 2; Ela: Elastase; Try: Trypsin; WT: Wild-type; KO: Nkcc1-/-; Pdx1: Pancreatic duodenal homeobox 1; Ins1: Insulin1; Glut2: Glucose transporter type 2.
- Citation: Bradford EM, Vairamani K, Shull GE. Differential expression of pancreatic protein and chemosensing receptor mRNAs in NKCC1-null intestine. World J Gastrointest Pathophysiol 2016; 7(1): 138-149
- URL: https://www.wjgnet.com/2150-5330/full/v7/i1/138.htm
- DOI: https://dx.doi.org/10.4291/wjgp.v7.i1.138


