Copyright
©2014 Baishideng Publishing Group Inc.
World J Gastrointest Pathophysiol. Aug 15, 2014; 5(3): 252-270
Published online Aug 15, 2014. doi: 10.4291/wjgp.v5.i3.252
Published online Aug 15, 2014. doi: 10.4291/wjgp.v5.i3.252
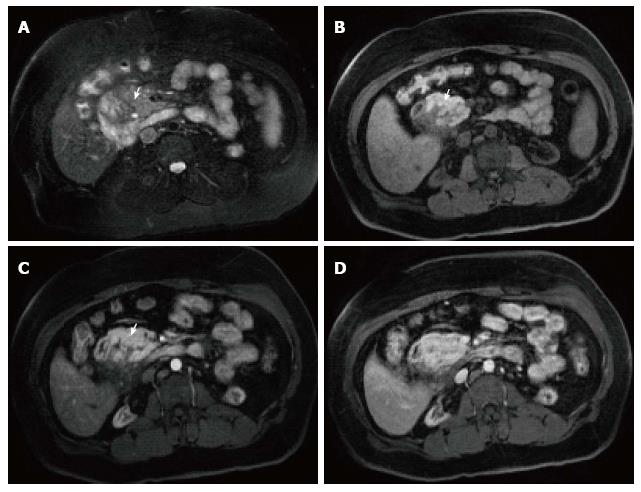
Figure 21 Groove pancreatitis.
A: Axial T2-weighted single-shot fast spin-echo (SS-FSE) images with fat-suppression; (B) Pre- and (C, D) Post-contrast 3D-GRE T1- weighted images with fat-suppression during the late arterial and portal venous phases. There is a slightly low T2 signal sheet-like mass in the pancreaticoduodenal groove, with tiny cystic changes (arrow, A). The mass shows low T1 signal with extension into the pancreatic head (arrow, B). Imperceptible enhancement is depicted on the immediate post-contrast image (arrow, C), with progressive enhancement on the subsequent delayed images (D) in keeping with groove pancreatitis.
- Citation: Busireddy KK, AlObaidy M, Ramalho M, Kalubowila J, Baodong L, Santagostino I, Semelka RC. Pancreatitis-imaging approach. World J Gastrointest Pathophysiol 2014; 5(3): 252-270
- URL: https://www.wjgnet.com/2150-5330/full/v5/i3/252.htm
- DOI: https://dx.doi.org/10.4291/wjgp.v5.i3.252


