Copyright
©2014 Baishideng Publishing Group Co.
World J Gastrointest Pathophysiol. Feb 15, 2014; 5(1): 33-39
Published online Feb 15, 2014. doi: 10.4291/wjgp.v5.i1.33
Published online Feb 15, 2014. doi: 10.4291/wjgp.v5.i1.33
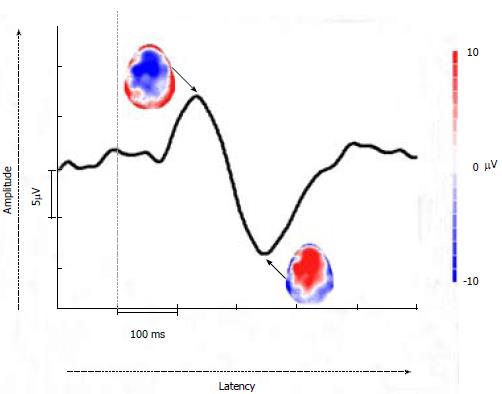
Figure 2 A typical visceral evoked potential at the central site on the scalp (Cz electrode).
The two main peaks can be seen from the waveform. The two topographies at each of the peaks, representing the amplitude of evoked potentials over the entire scalp, are shown. Evoked potential waveforms and topographies can be used to analyze changes in amplitudes, latencies, and topographical distribution due to pain in chronic pancreatitis.
- Citation: Lelic D, Olesen SS, Graversen C, Brock C, Valeriani M, Drewes AM. Electrophysiology as a tool to unravel the origin of pancreatic pain. World J Gastrointest Pathophysiol 2014; 5(1): 33-39
- URL: https://www.wjgnet.com/2150-5330/full/v5/i1/33.htm
- DOI: https://dx.doi.org/10.4291/wjgp.v5.i1.33


