Copyright
©2014 Baishideng Publishing Group Co.
World J Gastrointest Pathophysiol. Feb 15, 2014; 5(1): 33-39
Published online Feb 15, 2014. doi: 10.4291/wjgp.v5.i1.33
Published online Feb 15, 2014. doi: 10.4291/wjgp.v5.i1.33
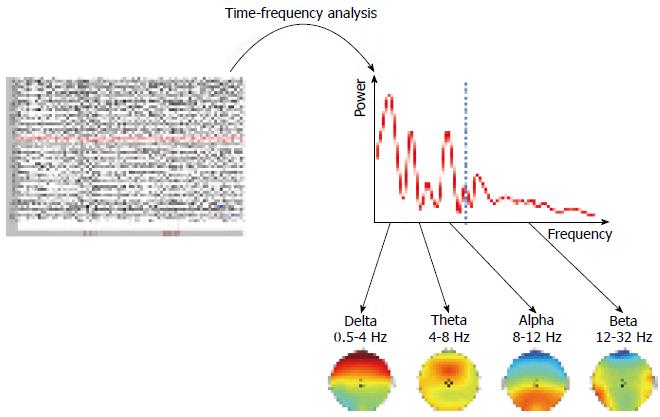
Figure 1 Spectral analysis of resting electroencephalography.
The multi-channel resting electroencephalography is recorded, and pre-processed including filtering, interpolation of channels with abnormal signal shape and de-artifacting. For each channel (in this example the Cz electrode - highlighted in red), time-frequency analysis is applied to extract the spectral distribution of the signal. The distribution is summed in standard frequency bands: delta, theta, alpha and beta, and results for each band presented on topographical maps (the Cz results are indicated by a black circle). Each channel shows its own spectral distribution, with the typical pattern: delta (frontal), theta (centro-frontal), alpha (occipital), and beta (temporal).
- Citation: Lelic D, Olesen SS, Graversen C, Brock C, Valeriani M, Drewes AM. Electrophysiology as a tool to unravel the origin of pancreatic pain. World J Gastrointest Pathophysiol 2014; 5(1): 33-39
- URL: https://www.wjgnet.com/2150-5330/full/v5/i1/33.htm
- DOI: https://dx.doi.org/10.4291/wjgp.v5.i1.33


