Copyright
©2013 Baishideng Publishing Group Co.
World J Gastrointest Pathophysiol. May 15, 2013; 4(2): 28-36
Published online May 15, 2013. doi: 10.4291/wjgp.v4.i2.28
Published online May 15, 2013. doi: 10.4291/wjgp.v4.i2.28
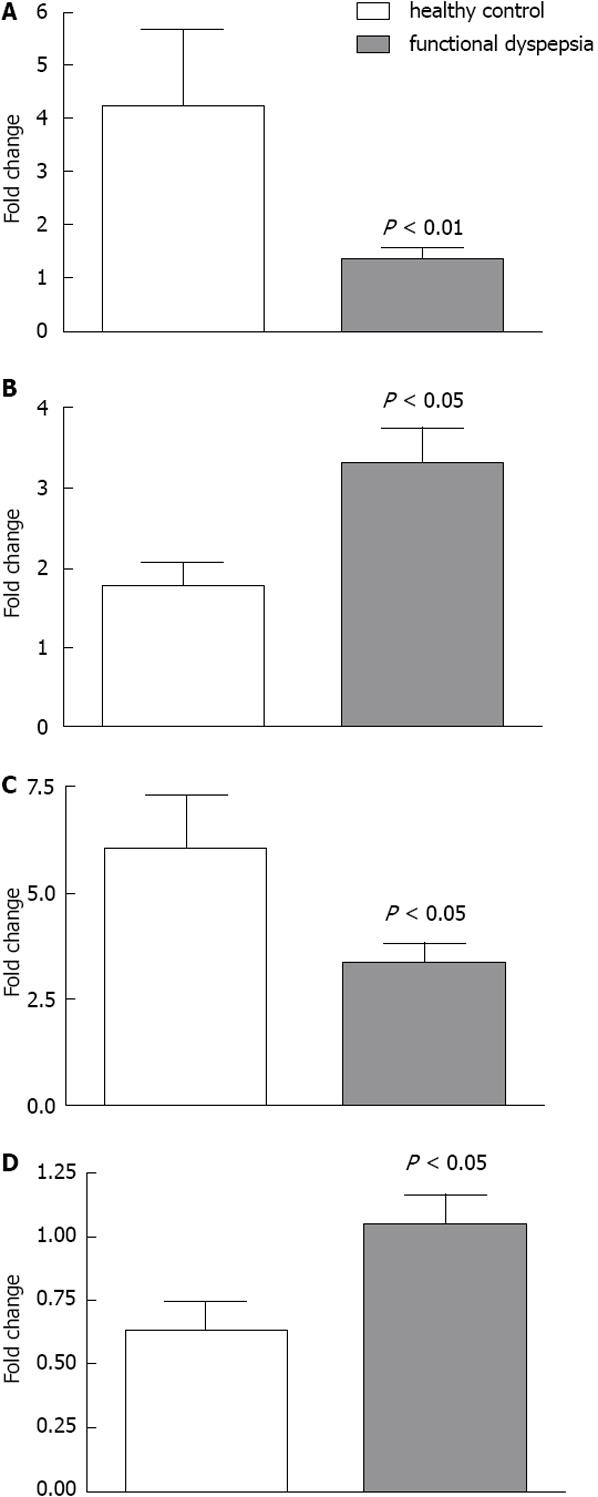
Figure 4 Gene expression (mRNA) levels differed significantly in duodenal mucosa from functional dyspepsia patients compared to healthy controls.
A: HTR3E; B: HTR7; C: SLC4A6; D: TPH1. Empty bars represent patients (n = 10 for HTR3E, SLC4A6 and TPH1, and n = 8 for HTR7) and filled bars represent controls (n = 16 for SLC4A6 and TPH1, n = 15 for HTR3E and n = 13 for HTR7). All levels were measured by quantitative real-time polymerase chain reaction and expressed as mean fold change ± SE relative to the values obtained for a control sample arbitrarily chosen as a reference. P < 0.05, P < 0.01 vs control group.
- Citation: Witte AB, D’Amato M, Poulsen SS, Laurent A, Knuhtsen S, Bindslev N, Hansen MB, Schmidt PT. Duodenal epithelial transport in functional dyspepsia: Role of serotonin. World J Gastrointest Pathophysiol 2013; 4(2): 28-36
- URL: https://www.wjgnet.com/2150-5330/full/v4/i2/28.htm
- DOI: https://dx.doi.org/10.4291/wjgp.v4.i2.28


