Copyright
©2012 Baishideng Publishing Group Co.
World J Gastrointest Pathophysiol. Oct 15, 2012; 3(5): 92-98
Published online Oct 15, 2012. doi: 10.4291/wjgp.v3.i5.92
Published online Oct 15, 2012. doi: 10.4291/wjgp.v3.i5.92
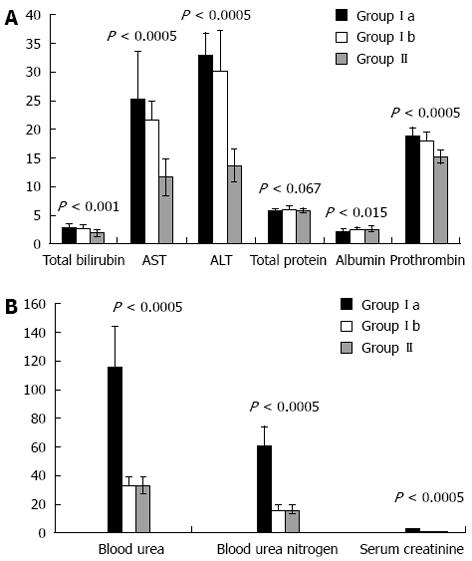
Figure 1 Comparison of groups Ia, Ib and II with regards to liver (A) and renal (B) function tests.
Y-axis shows SI units of measurements.
- Citation: Suliman MA, Khalil FM, Alkindi SS, Pathare AV, Almadhani AA, Soliman NA. Tumor necrosis factor-α and interleukin-6 in cirrhotic patients with spontaneous bacterial peritonitis. World J Gastrointest Pathophysiol 2012; 3(5): 92-98
- URL: https://www.wjgnet.com/2150-5330/full/v3/i5/92.htm
- DOI: https://dx.doi.org/10.4291/wjgp.v3.i5.92


