Copyright
©The Author(s) 2024.
World J Gastrointest Pathophysiol. Apr 22, 2024; 15(1): 91237
Published online Apr 22, 2024. doi: 10.4291/wjgp.v15.i1.91237
Published online Apr 22, 2024. doi: 10.4291/wjgp.v15.i1.91237
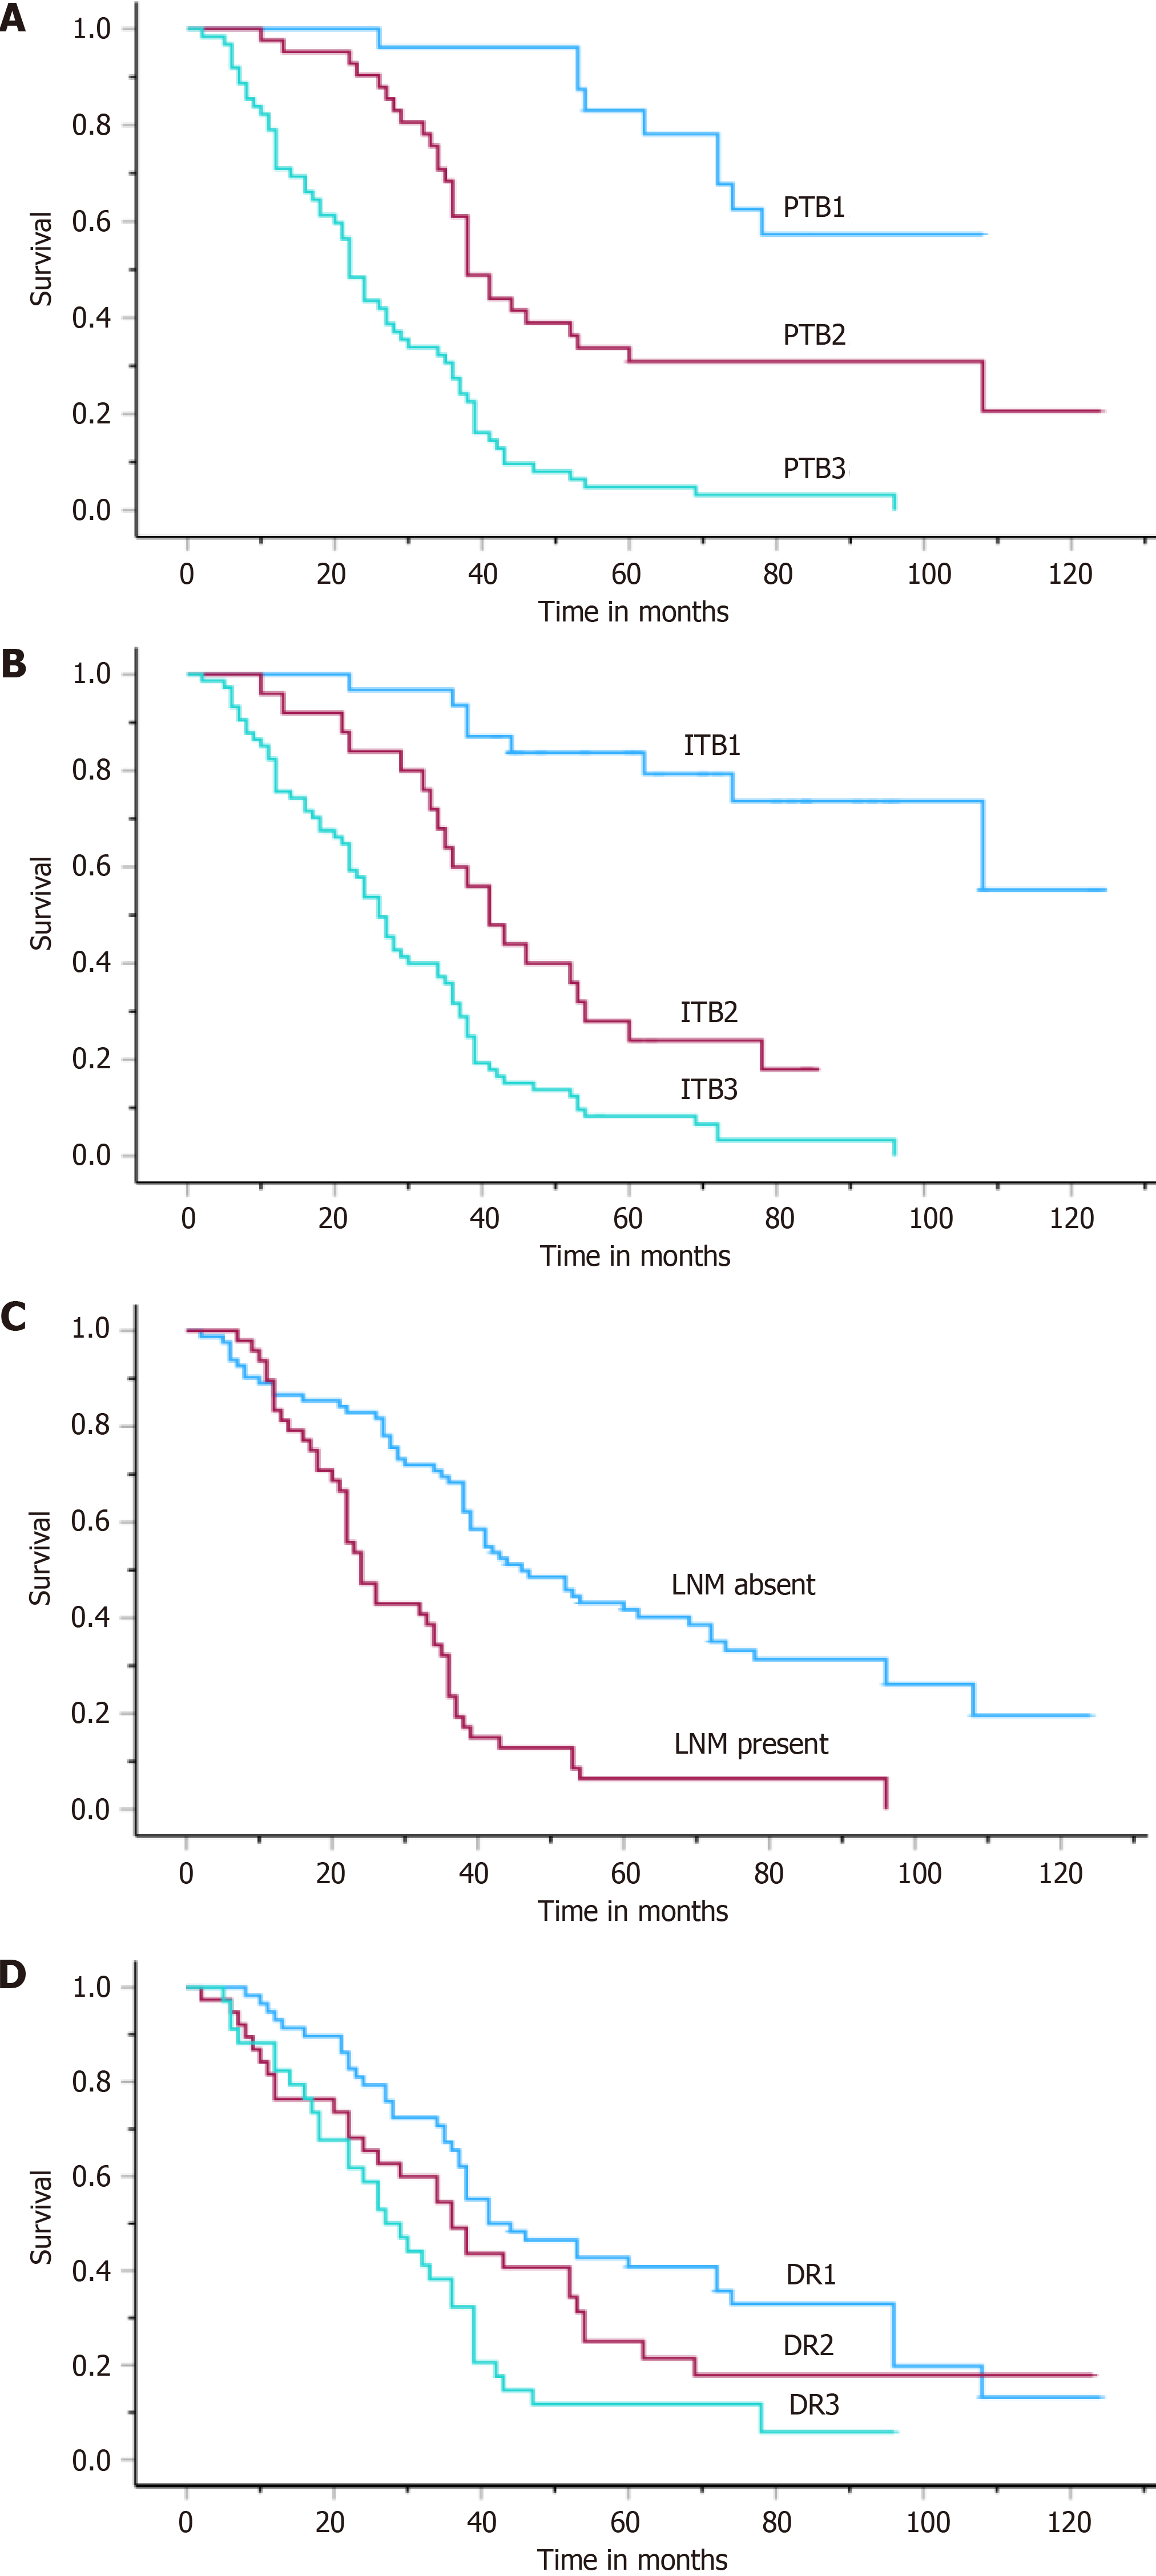
Figure 3 Kaplan-Meier curves of survival analyses in the total cohort.
A: Peritumoral budding (log-rank test P < 0.001); B: Intratumoral budding (log-rank test P < 0.001); C: The presence of lymph node metastasis (log-rank test P < 0.002): Desmoplastic reaction (log-rank test P < 0.002). PTB: Peritumoral budding; ITB: Intratumoral budding; LNM: Lymph node metastasis; DR: Desmoplastic reaction.
- Citation: Yavuz A, Simsek K, Alpsoy A, Altunay B, Gedik EO, Unal B, Bassorgun CI, Tatli AM, Elpek GO. Prognostic significance of tumor budding, desmoplastic reaction, and lymphocytic infiltration in patients with gastric adenocarcinoma. World J Gastrointest Pathophysiol 2024; 15(1): 91237
- URL: https://www.wjgnet.com/2150-5330/full/v15/i1/91237.htm
- DOI: https://dx.doi.org/10.4291/wjgp.v15.i1.91237


