Copyright
©The Author(s) 2022.
World J Gastrointest Pathophysiol. May 22, 2022; 13(3): 73-84
Published online May 22, 2022. doi: 10.4291/wjgp.v13.i3.73
Published online May 22, 2022. doi: 10.4291/wjgp.v13.i3.73
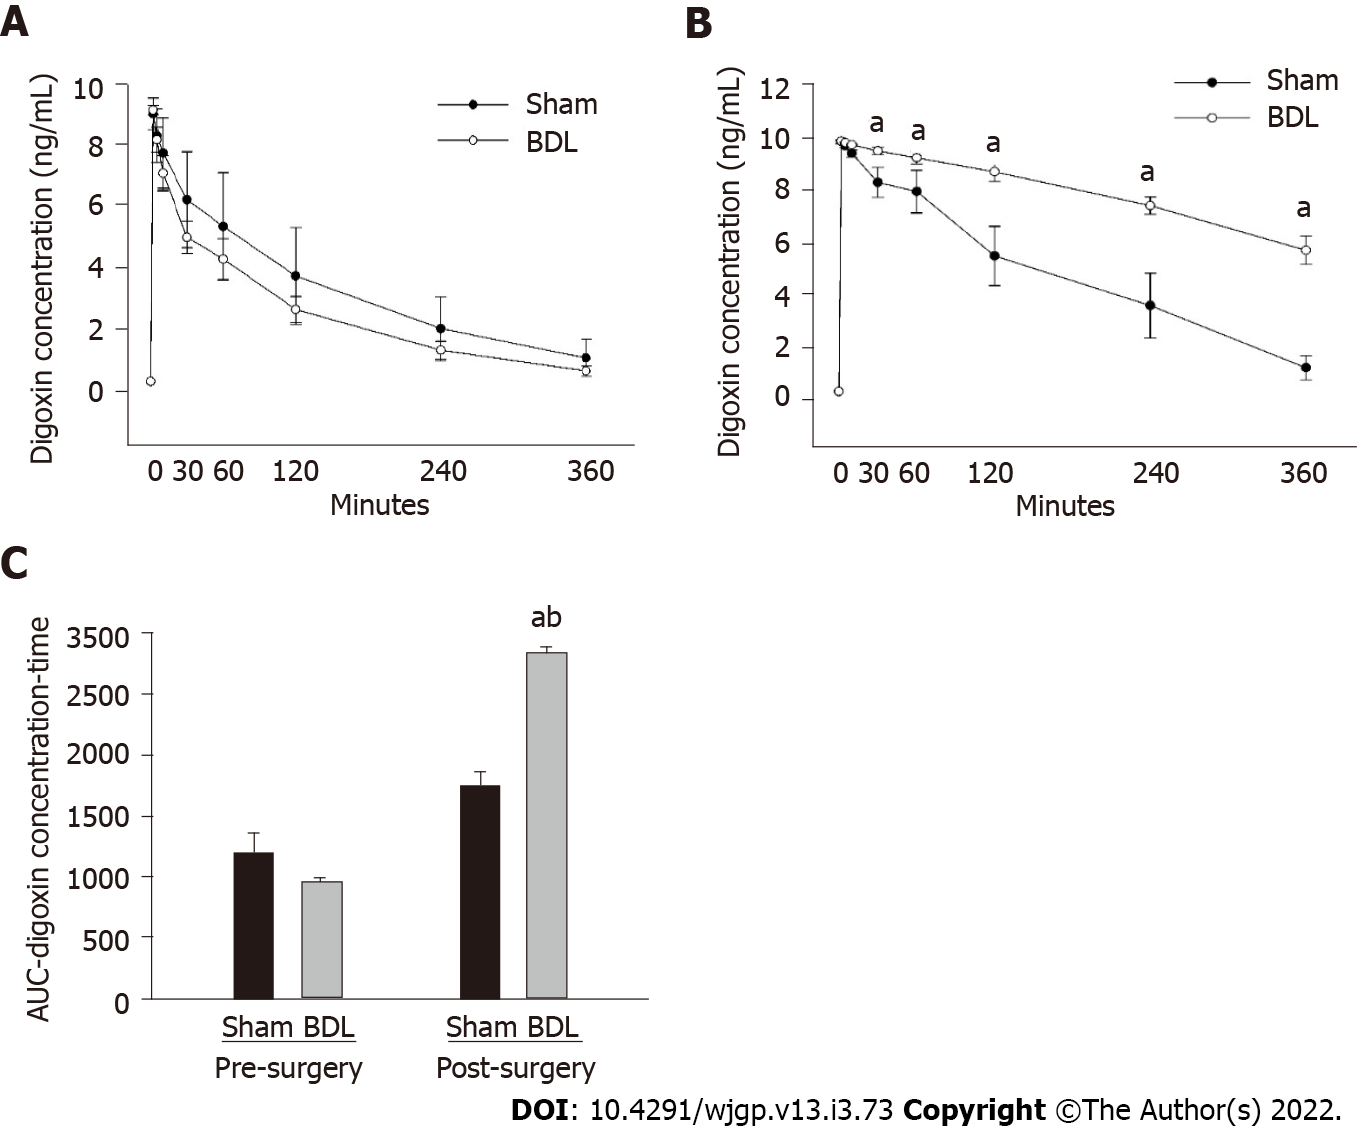
Figure 1 Effect of bile duct ligation on pharmacokinetics of digoxin in rats.
A: Pre-surgery digoxin pharmacokinetic studies was compared and presented as digoxin concentration-versus-time line curves; B: Post-surgery digoxin pharmacokinetic studies were compared and presented as digoxin concentration-versus-time line curves, C: Area under the curve, the area under the digoxin plasma concentration-versus-time. Values are expressed as means ± SD, n = 6; aP < 0.05 vs pre-surgery bile duct ligation group, bP < 0.05 vs post-surgery sham. BDL: Bile duct ligation; AUC: Area under the curve.
- Citation: Giroux P, Kyle PB, Tan C, Edwards JD, Nowicki MJ, Liu H. Evaluating the regulation of transporter proteins and P-glycoprotein in rats with cholestasis and its implication for digoxin clearance. World J Gastrointest Pathophysiol 2022; 13(3): 73-84
- URL: https://www.wjgnet.com/2150-5330/full/v13/i3/73.htm
- DOI: https://dx.doi.org/10.4291/wjgp.v13.i3.73


