Copyright
©The Author(s) 2021.
World J Gastrointest Pathophysiol. Nov 22, 2021; 12(6): 115-133
Published online Nov 22, 2021. doi: 10.4291/wjgp.v12.i6.115
Published online Nov 22, 2021. doi: 10.4291/wjgp.v12.i6.115
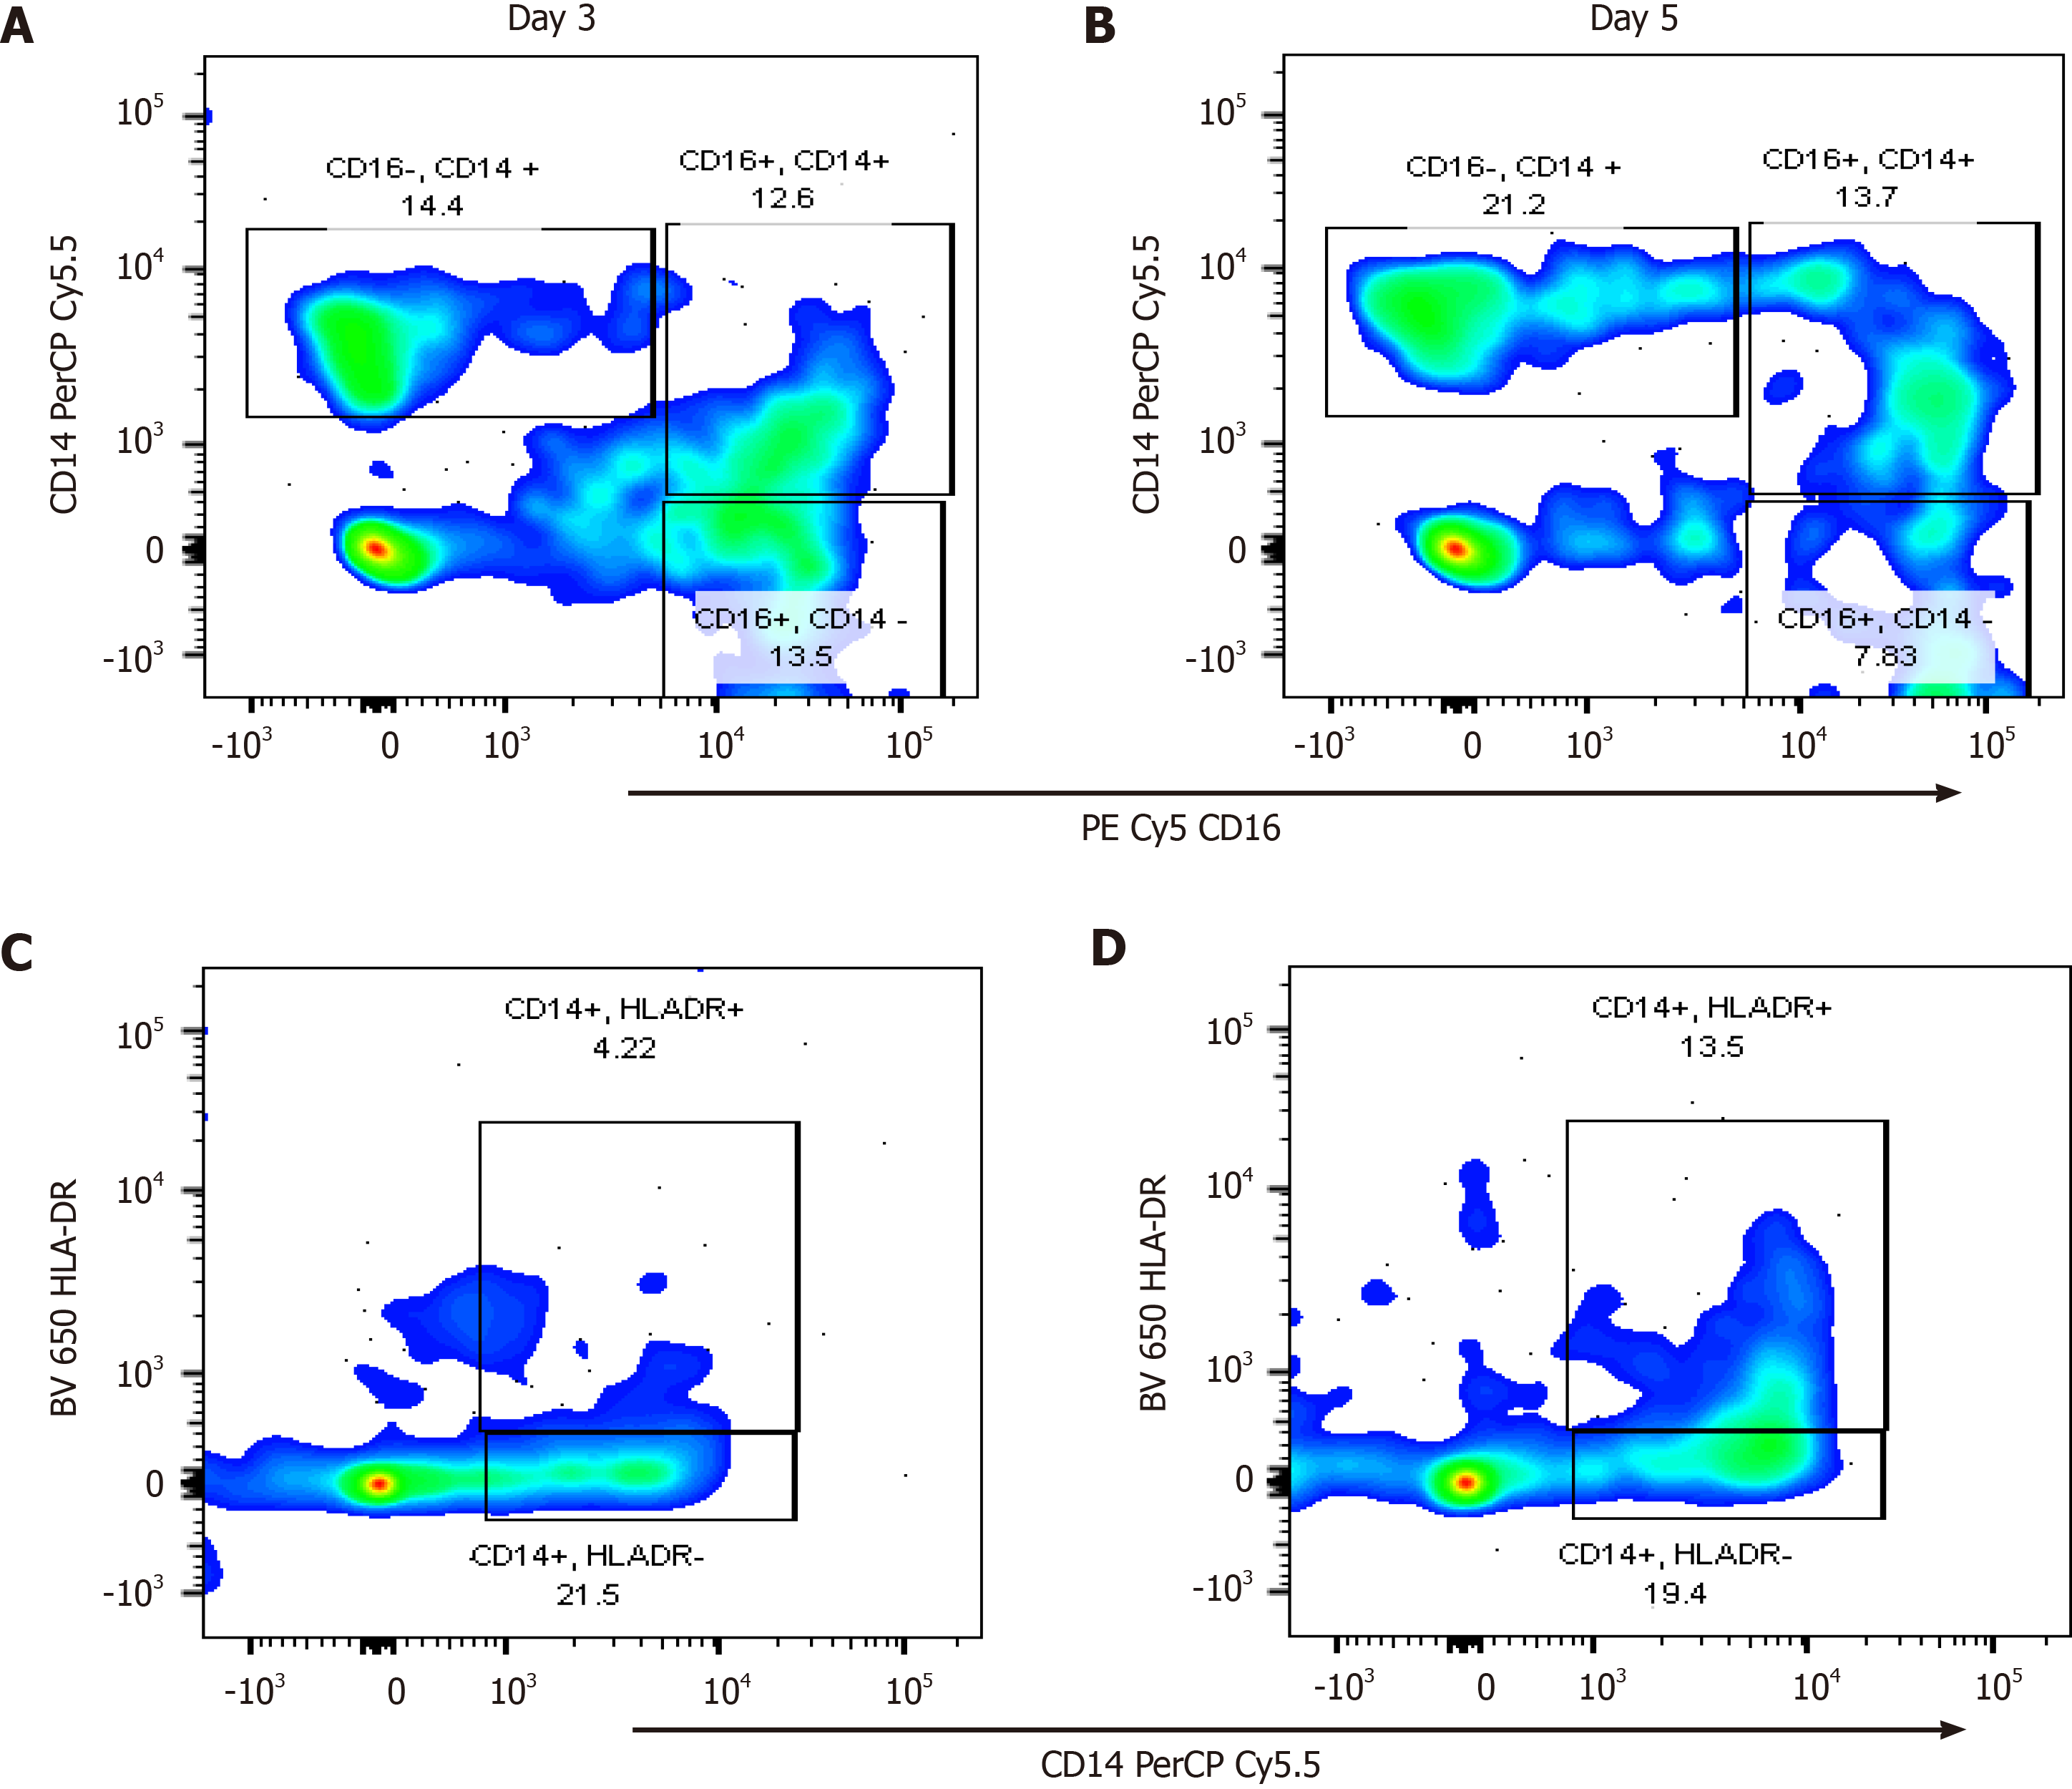
Figure 6 A plot generated from FlowJo™ version 10 (Oregon, United States) of an severe acute pancreatitis patient for the monocyte subpopulations.
Cells were gated into intermediate (CD16+CD14+), classical (CD16-CD14+) and non-classical monocytes (CD16+CD14-). A and B: They showed CD14CD16 plot for Day 3 and Day 5 respectively. C and D: They showed a plot of CD14HLA-DR for Day 3 and 5 respectively. The percentage of HLA-DR+ monocytes increased from 4% on Day 3 to 13% on Day 5. BUV: BD Horizon Brilliant™ Ultraviolet; CD: Cluster of differentiation; Cy: Cyanine; BV: Brilliant Violet™; HLA DR: Human leukocyte D related; PE: Phycoerythrin; PerCP: Peridinin-Chlorophyll-protein; CD: Cluster of differentiation.
- Citation: Nalisa M, Nweke EE, Smith MD, Omoshoro-Jones J, Devar JW, Metzger R, Augustine TN, Fru PN. Chemokine receptor 8 expression may be linked to disease severity and elevated interleukin 6 secretion in acute pancreatitis. World J Gastrointest Pathophysiol 2021; 12(6): 115-133
- URL: https://www.wjgnet.com/2150-5330/full/v12/i6/115.htm
- DOI: https://dx.doi.org/10.4291/wjgp.v12.i6.115


