Copyright
©The Author(s) 2021.
World J Gastrointest Pathophysiol. Nov 22, 2021; 12(6): 115-133
Published online Nov 22, 2021. doi: 10.4291/wjgp.v12.i6.115
Published online Nov 22, 2021. doi: 10.4291/wjgp.v12.i6.115
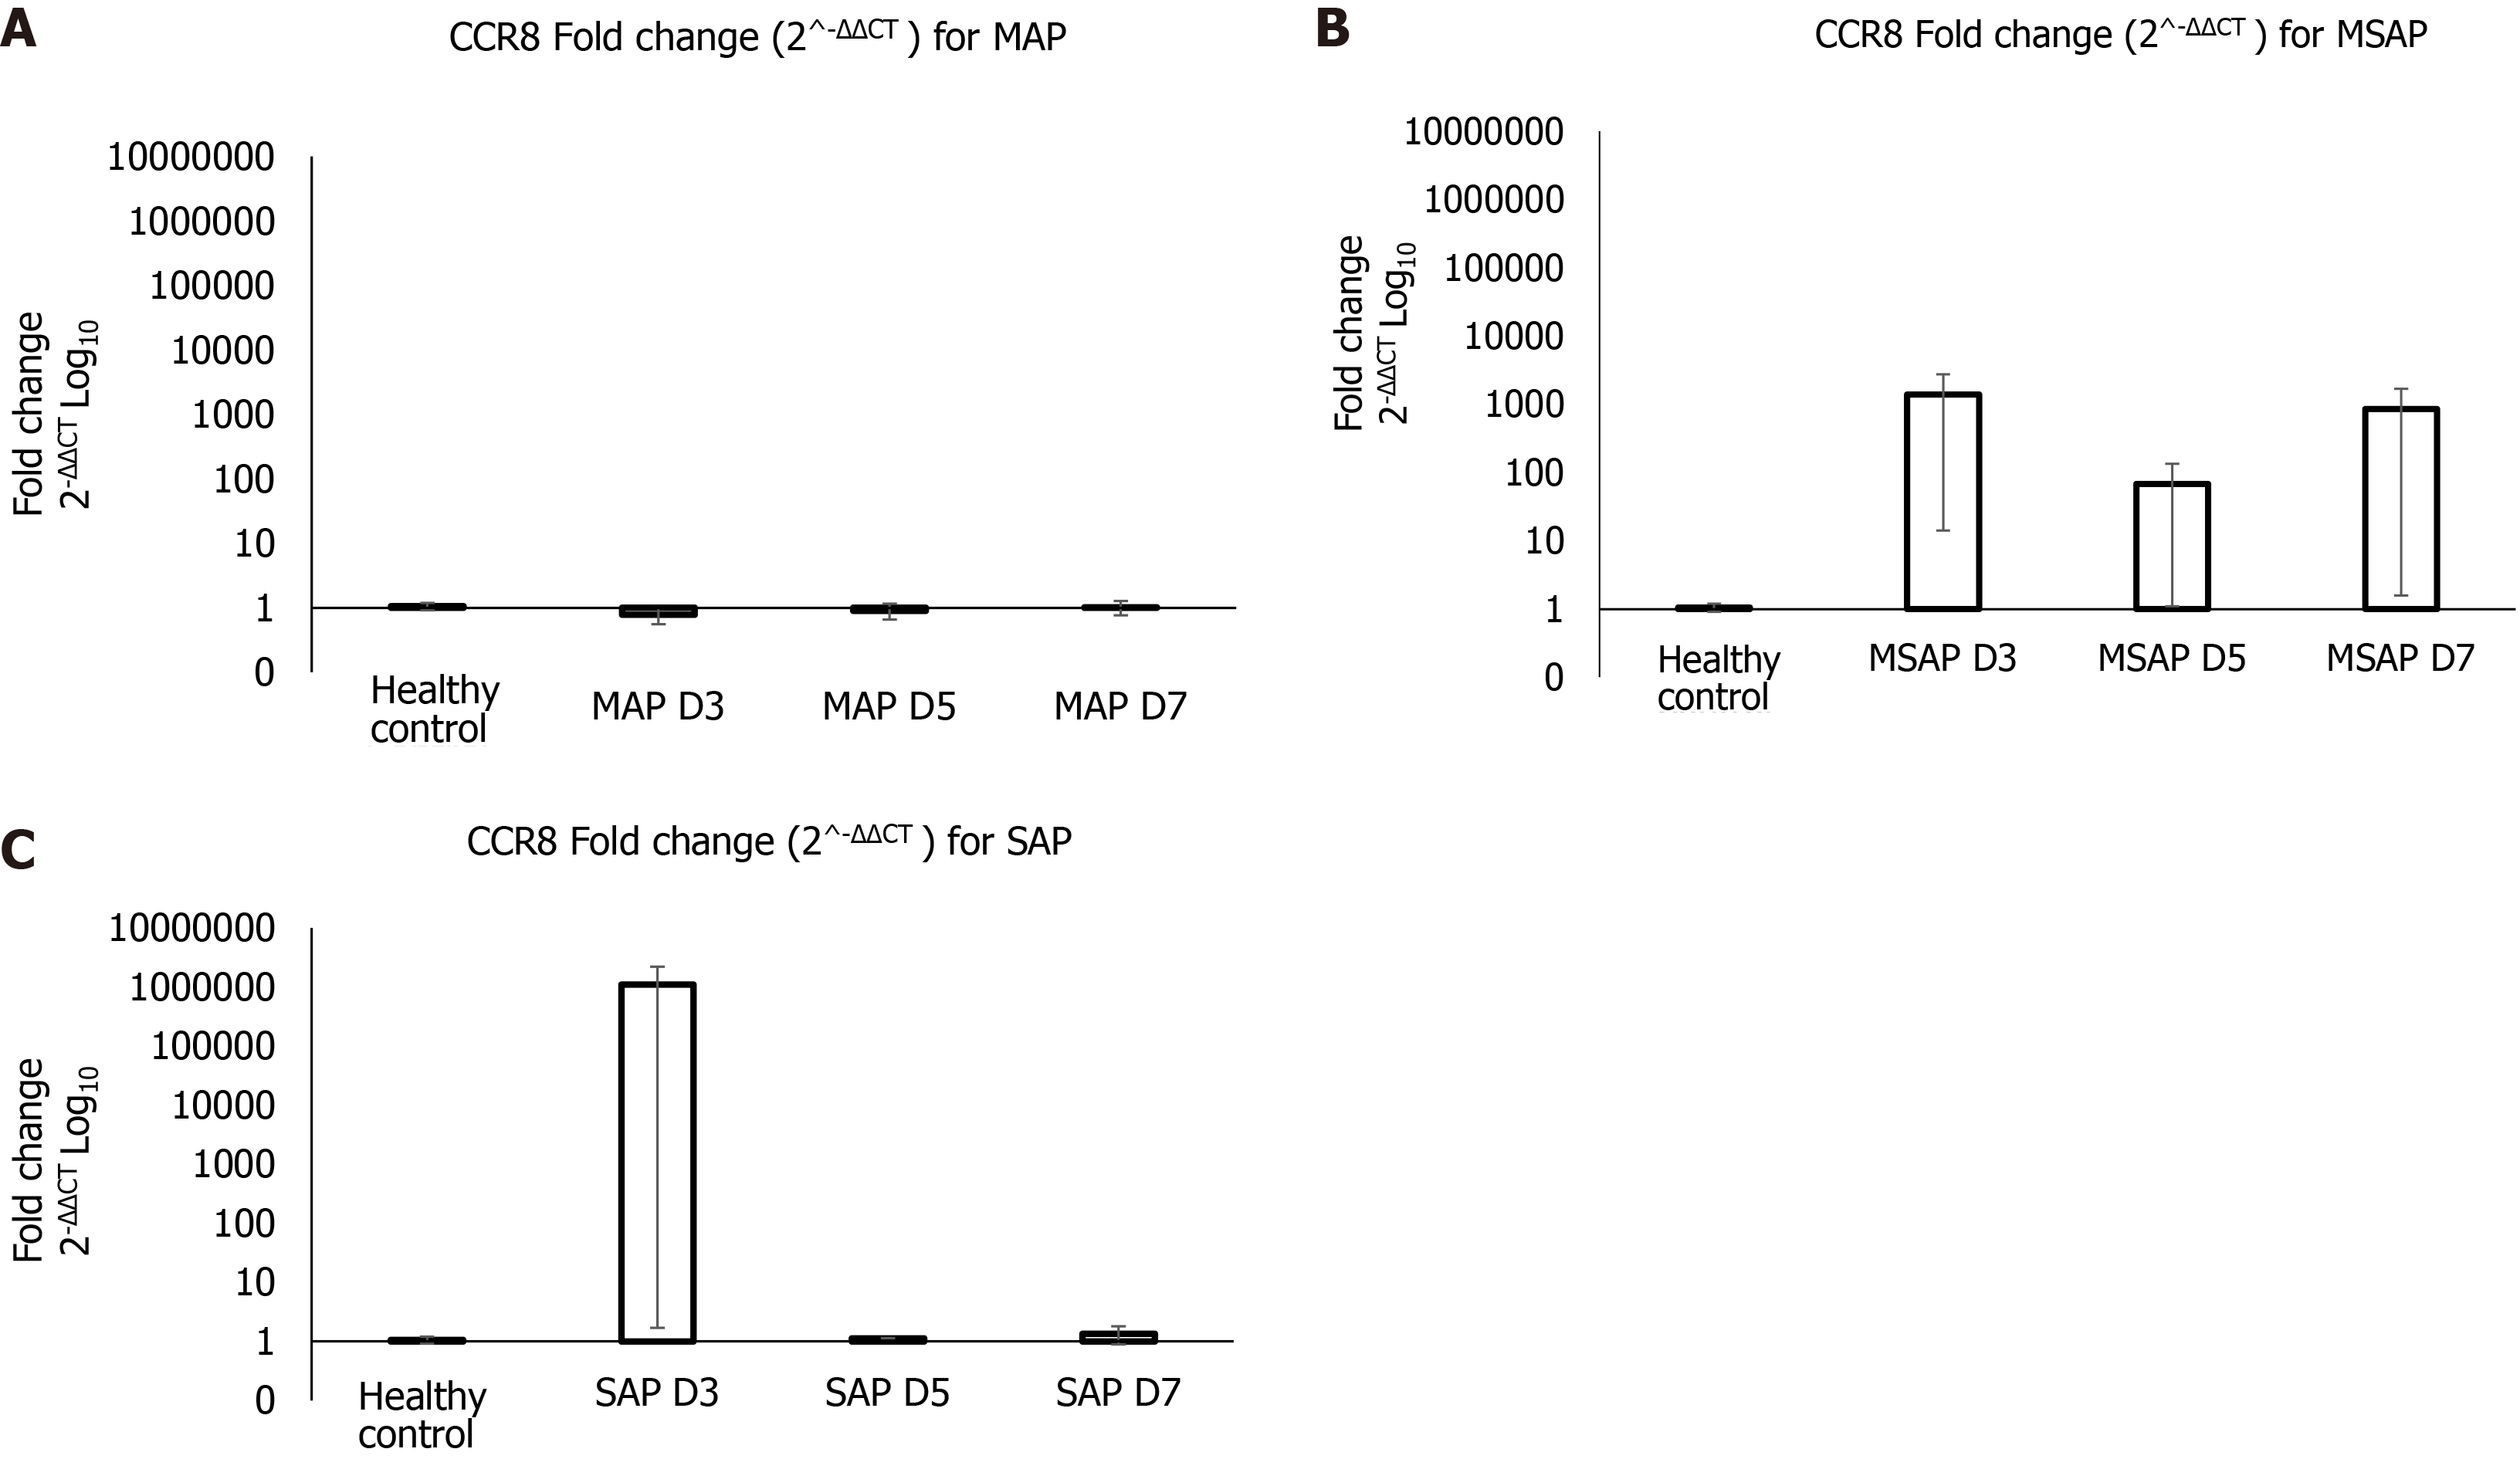
Figure 4 Gene expression analysis for chemokine receptor 8 in different severities at Day 3, 5 and 7 post epigastric pain due to acute pancreatitis for mild acute pancreatitis, moderately severe acute pancreatitis, and severe acute pancreatitis.
The data is shown on a Log10 transformed scale of the fold change (2-ΔΔCT) normalized using RPL13A gene on VIC fluorescent dye (Hs04194366_g1, Thermo Fischer Scientific) as reference gene. A: The FC of CCR8 was less than 1 at D3 and D5, then increased slightly to 1 at D7 for MAP group compared to healthy controls. B: At D3 and D7 the FC for the MSAP group was 1000 times more than in the healthy controls. C: In the SAP group the FC at D3 was 1000000 times more than in the healthy controls and the D5 and D7 was 1 time more. FC: fold change. D: D3 of the specific severity group; MAP: Mild acute pancreatitis: MSAP: Moderately severe acute pancreatitis; SAP: Severe acute pancreatitis; CCR8: Chemokine receptor 8.
- Citation: Nalisa M, Nweke EE, Smith MD, Omoshoro-Jones J, Devar JW, Metzger R, Augustine TN, Fru PN. Chemokine receptor 8 expression may be linked to disease severity and elevated interleukin 6 secretion in acute pancreatitis. World J Gastrointest Pathophysiol 2021; 12(6): 115-133
- URL: https://www.wjgnet.com/2150-5330/full/v12/i6/115.htm
- DOI: https://dx.doi.org/10.4291/wjgp.v12.i6.115


