Copyright
©The Author(s) 2019.
World J Gastrointest Pathophysiol. Nov 13, 2019; 10(4): 42-53
Published online Nov 13, 2019. doi: 10.4291/wjgp.v10.i4.42
Published online Nov 13, 2019. doi: 10.4291/wjgp.v10.i4.42
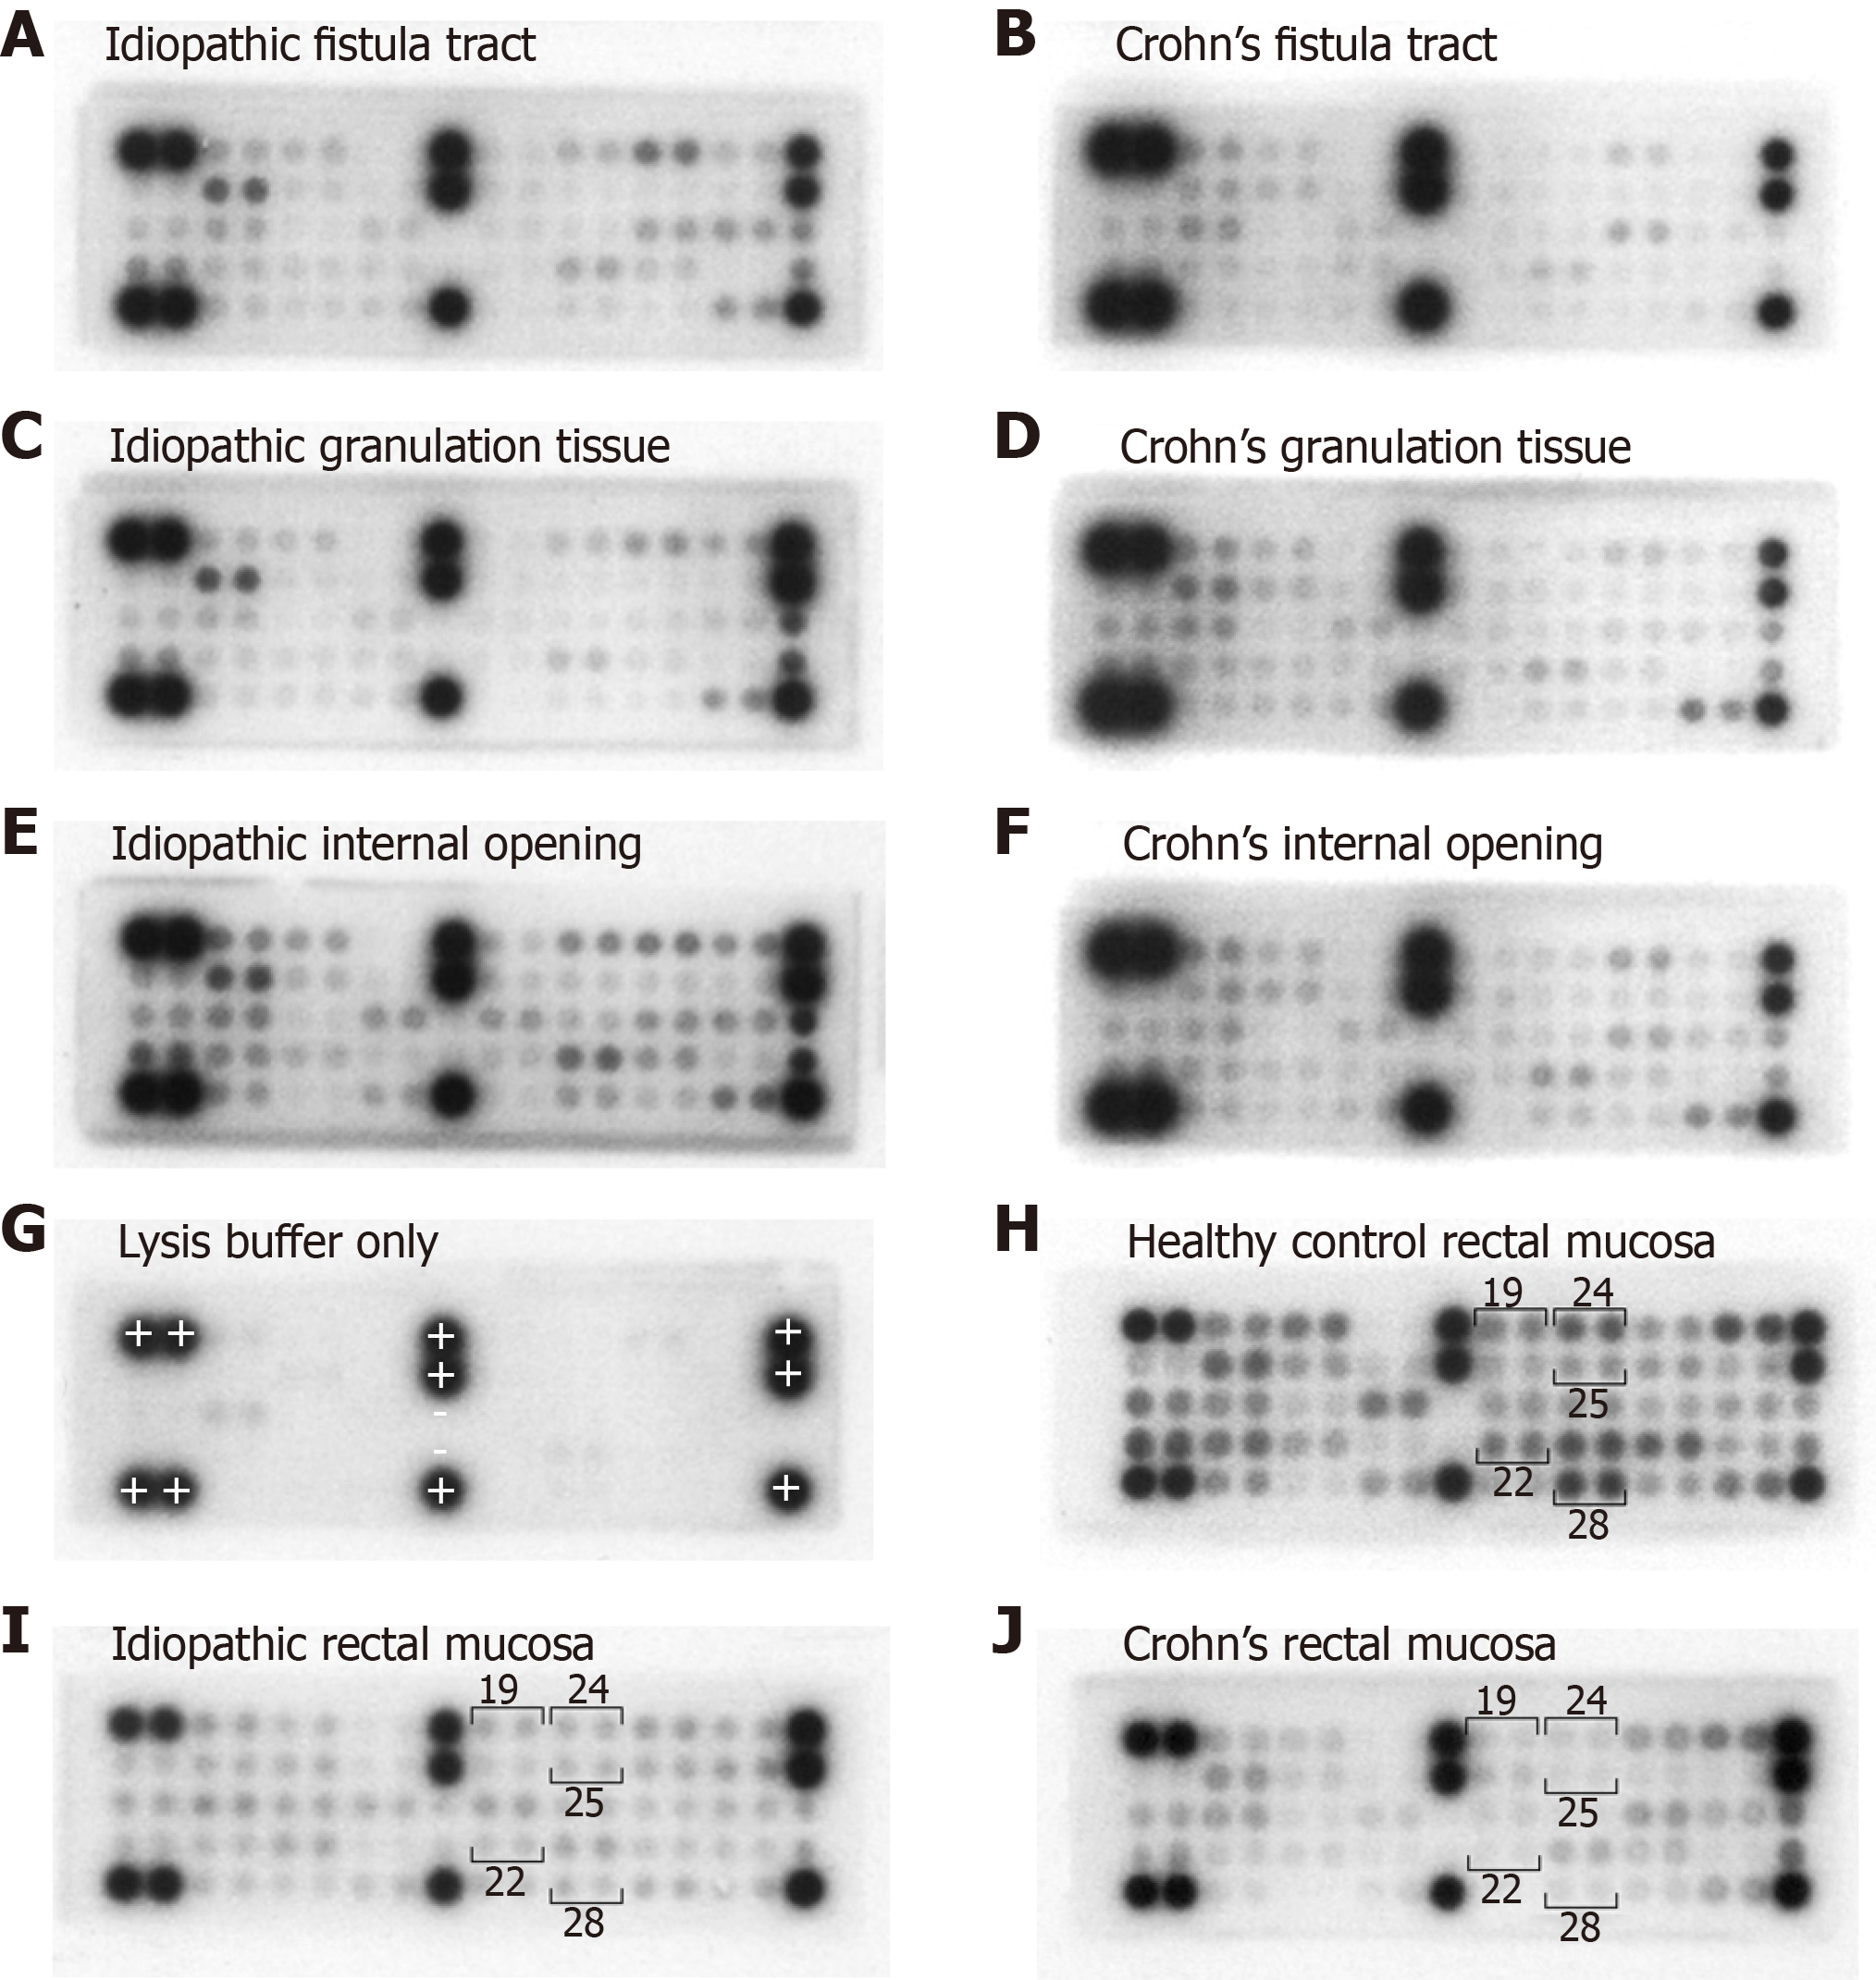
Figure 4 Example microarray images acquired to quantify the phosphorylation status of receptor tyrosine kinases in the cell lysates of the fresh tissue samples using the PathScan RTK Signaling Antibody Array, Chemiluminescent Readout (Cell Signaling Technology, Danvers, Massachusetts).
Fistula tract samples from (A) idiopathic and (B) Crohn’s disease patients. Granulation tissue samples from (C) idiopathic and (D) Crohn’s disease patients. Internal opening samples from (E) idiopathic and (F) Crohn’s disease patients. Control array containing lysis buffer only (G), showing an absent signal from all test spots and the negative control spots (-), and 100% signal from the positive control spots (+). Healthy control rectal mucosa (H) showing positive signal from numerous spots including EphA1 (19), EphB1 (22), EphB4 (24), Tyro3/Dtk (25) and VEGFR (28). Idiopathic rectal mucosa (I) showing significantly lower signal from the same highlighted spots. Crohnâs disease rectal mucosa (J), again showing significantly lower signal from the same highlighted spots.
- Citation: Haddow JB, Musbahi O, MacDonald TT, Knowles CH. Comparison of cytokine and phosphoprotein profiles in idiopathic and Crohn’s disease-related perianal fistula. World J Gastrointest Pathophysiol 2019; 10(4): 42-53
- URL: https://www.wjgnet.com/2150-5330/full/v10/i4/42.htm
- DOI: https://dx.doi.org/10.4291/wjgp.v10.i4.42


