Copyright
©The Author(s) 2019.
World J Gastrointest Pathophysiol. Nov 13, 2019; 10(4): 42-53
Published online Nov 13, 2019. doi: 10.4291/wjgp.v10.i4.42
Published online Nov 13, 2019. doi: 10.4291/wjgp.v10.i4.42
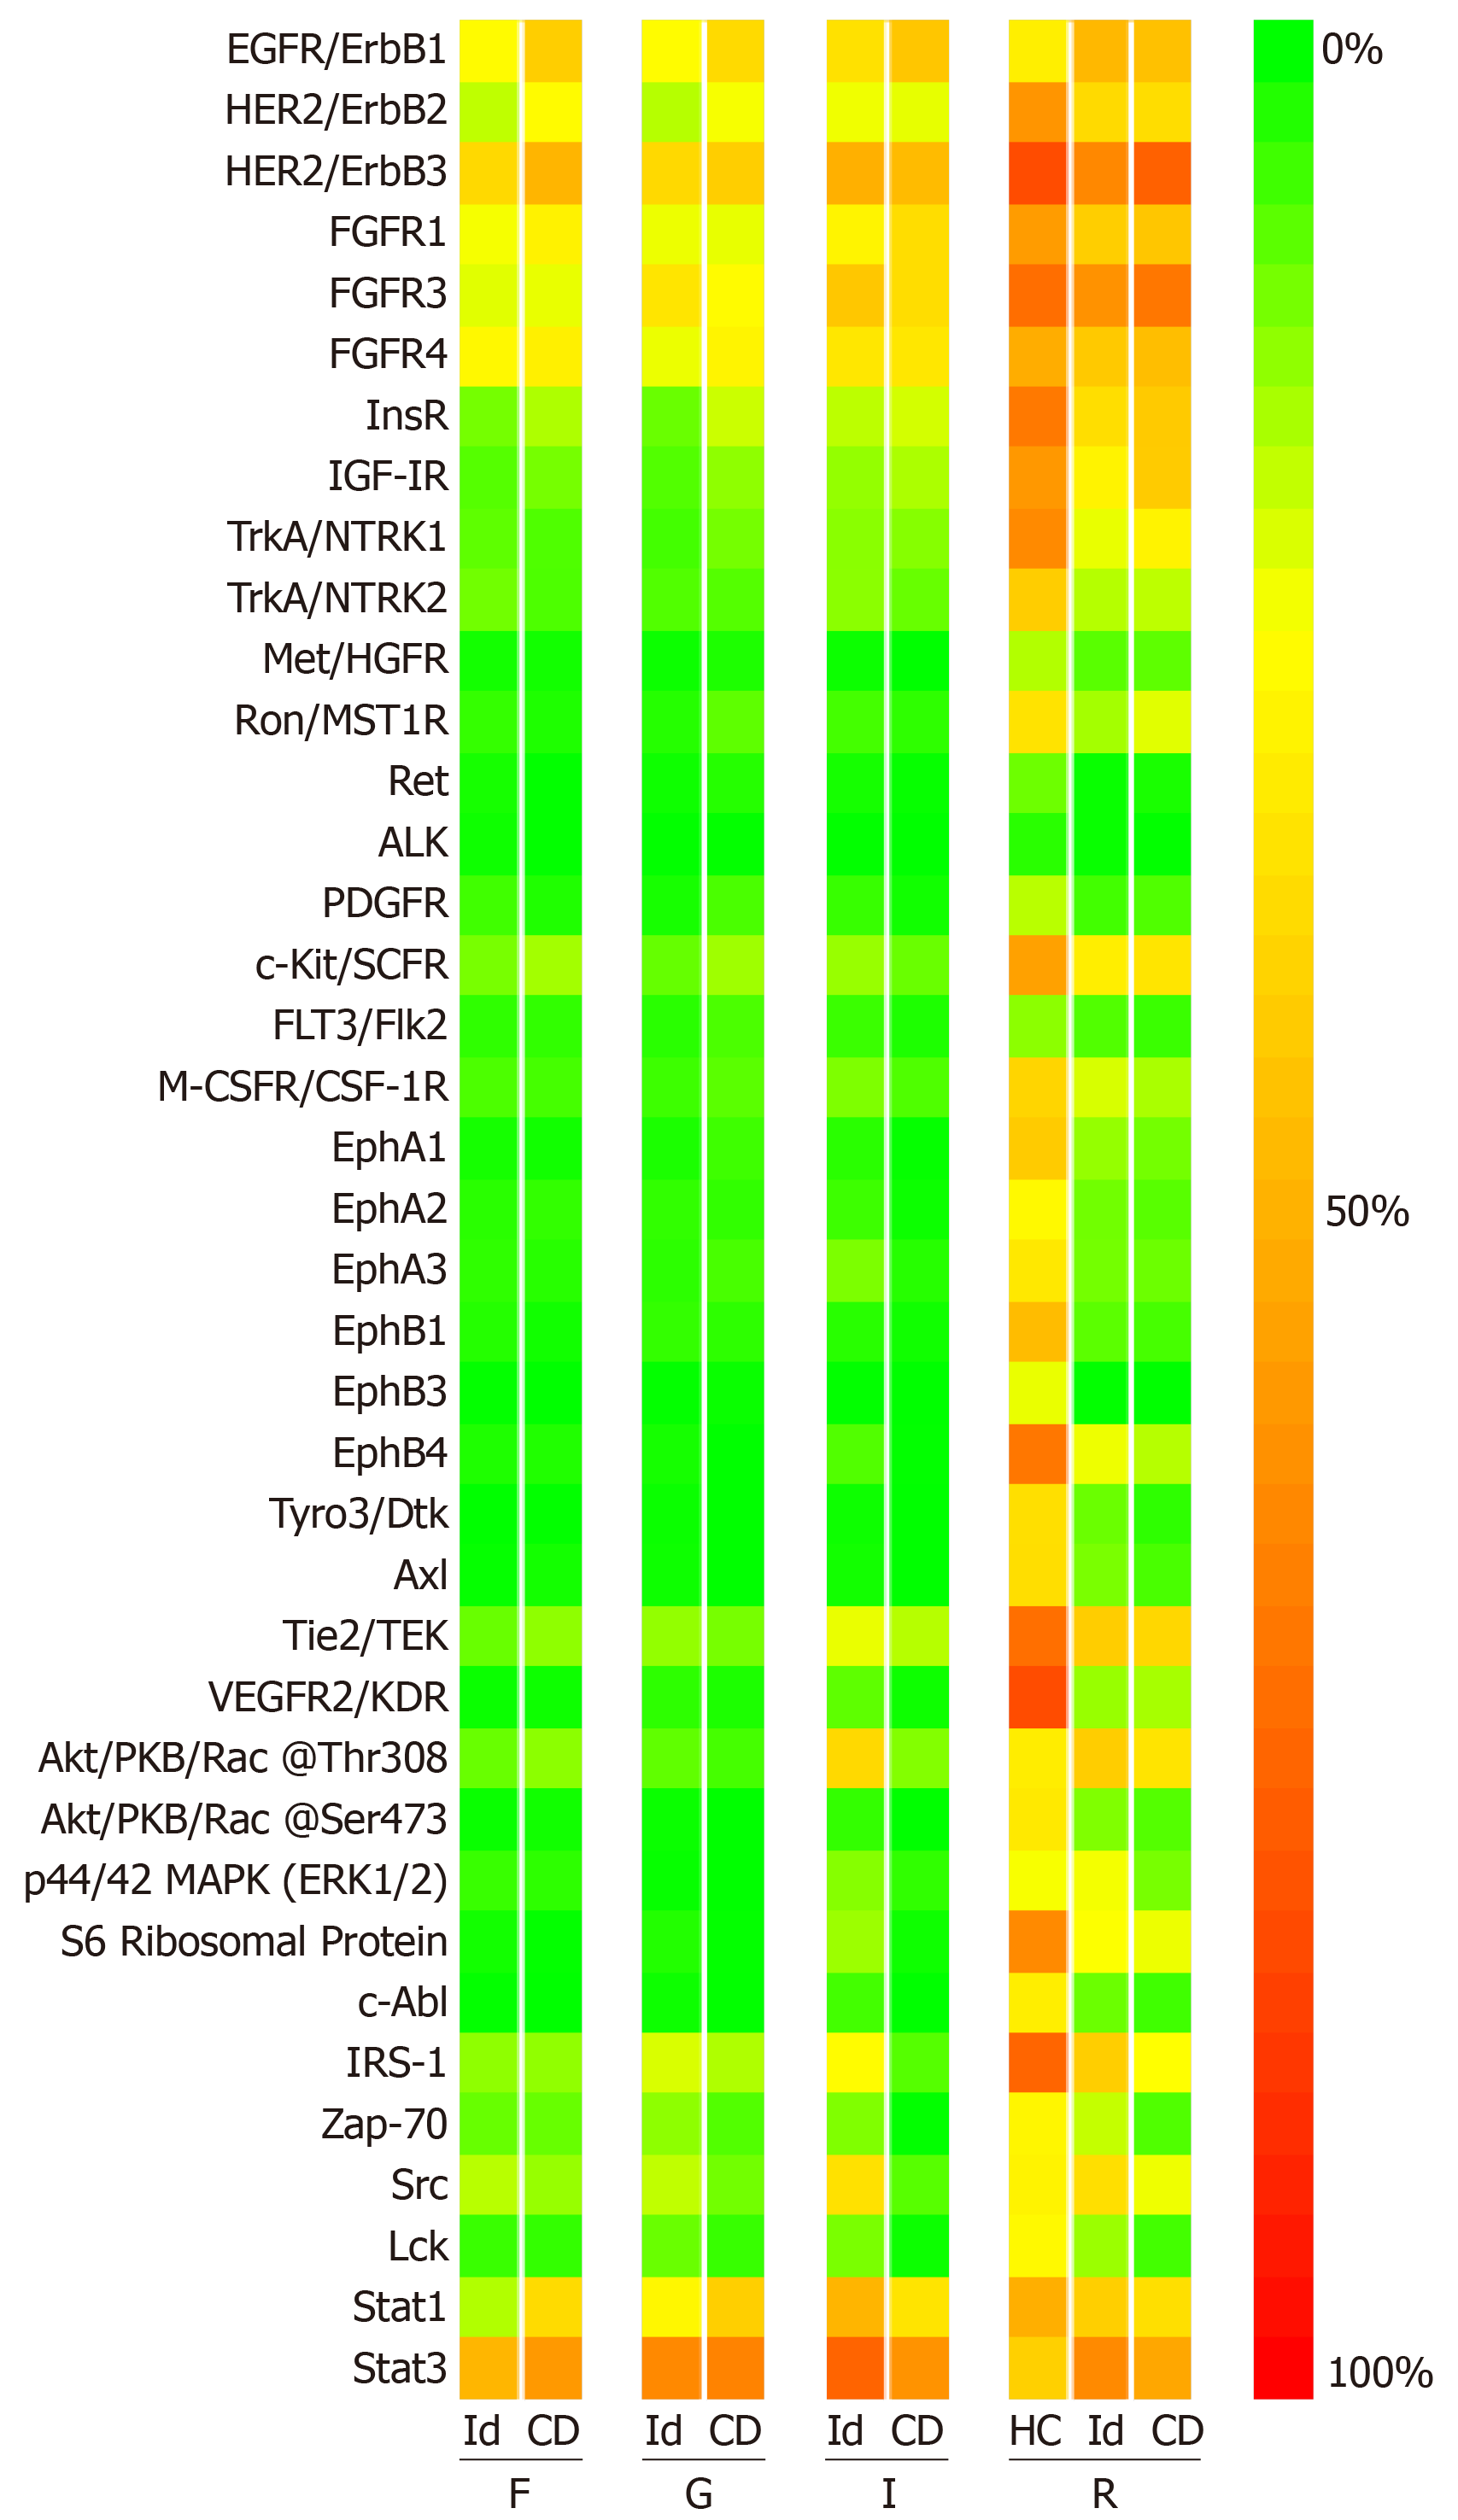
Figure 3 Median signal intensities (%) quantifying the phosphorylation status of receptor tyrosine kinases in the cell lysates of the fresh tissue samples using the PathScan RTK Signaling Antibody Array, Chemiluminescent Readout (Cell Signaling Technology, Danvers, Massachusetts).
The signal intensities were similar in the idiopathic and Crohn’s disease groups at the four specimen sites. When the Crohn’s disease group was compared to healthy controls, a statistically significant difference (Mann Witney U, P < 0.01) was seen for EphA1, EphB1, EphB4, Tyro3 and VEGFR2. Id: Idiopathic; CD: Crohn’s disease; HC: Healthy controls; F: Fistula tract; G: Granulation tissue; I: Internal opening; R: Rectal mucosa.
- Citation: Haddow JB, Musbahi O, MacDonald TT, Knowles CH. Comparison of cytokine and phosphoprotein profiles in idiopathic and Crohn’s disease-related perianal fistula. World J Gastrointest Pathophysiol 2019; 10(4): 42-53
- URL: https://www.wjgnet.com/2150-5330/full/v10/i4/42.htm
- DOI: https://dx.doi.org/10.4291/wjgp.v10.i4.42


