Copyright
©The Author(s) 2017.
World J Radiol. Jun 28, 2017; 9(6): 269-279
Published online Jun 28, 2017. doi: 10.4329/wjr.v9.i6.269
Published online Jun 28, 2017. doi: 10.4329/wjr.v9.i6.269
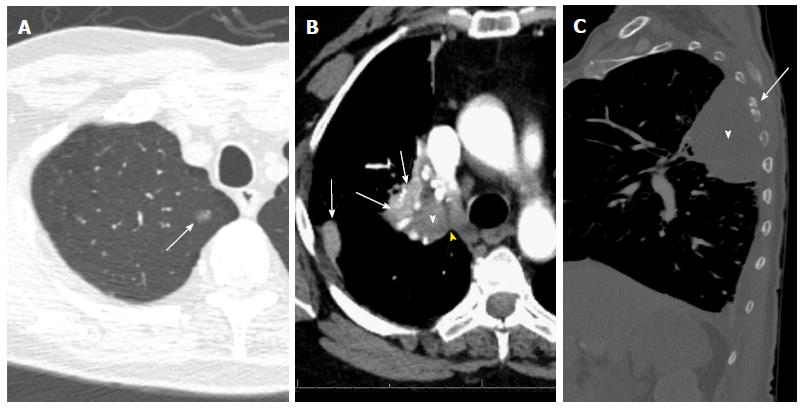
Figure 5 T descriptors.
A: T1a (mi): Groundglass opacity in the apical segment of the right upper lobe (arrow) on CT lung window image; resection revealed predominantly lepidic adenocarcinoma with 3-mm invasive component and clear margins; B: T2a: 4-cm invasive squamous cell bronchogenic carcinoma of the right upper lobar bronchus (white arrowhead) with adjacent areas of atelectasis (arrows) and clear cleavage plane with the mediastinum (yellow arrowhead) on contrast-enhanced CT image; C: T4 vs T3: 8.3cm left upper lobe mass (white arrowhead), with chest wall invasion causing destruction of the adjacent left 5th rib (arrow) and small left pleural effusion. Note that the highest descriptor should be used for T staging.
- Citation: Kay FU, Kandathil A, Batra K, Saboo SS, Abbara S, Rajiah P. Revisions to the Tumor, Node, Metastasis staging of lung cancer (8th edition): Rationale, radiologic findings and clinical implications. World J Radiol 2017; 9(6): 269-279
- URL: https://www.wjgnet.com/1949-8470/full/v9/i6/269.htm
- DOI: https://dx.doi.org/10.4329/wjr.v9.i6.269


