Copyright
©The Author(s) 2017.
World J Radiol. Jun 28, 2017; 9(6): 253-268
Published online Jun 28, 2017. doi: 10.4329/wjr.v9.i6.253
Published online Jun 28, 2017. doi: 10.4329/wjr.v9.i6.253
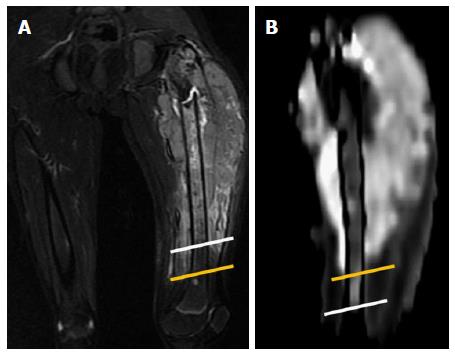
Figure 13 Case of Ewing’s sarcoma in a 12-year-old boy.
A: Coronal T2W-FS image showing altered marrow signal intensity in the femoral diaphysis (white line representing inferior extent) with associated soft tissue mass and surrounding edema (yellow line representing inferior extent); B: DWI shows restricted diffusion in the involved marrow which was significantly less (inferior extent represented by the white line) than that noted on the T2w Images thus differentiating the marrow edema from marrow infiltration and soft tissue edema from infiltration (yellow line representing inferior extent). The soft tissue mass shows restricted diffusion, suggestive of infiltrative tumor mass and not reactive inflammation. DWI: Diffusion-weighted imaging.
- Citation: Mahajan A, Deshpande SS, Thakur MH. Diffusion magnetic resonance imaging: A molecular imaging tool caught between hope, hype and the real world of “personalized oncology”. World J Radiol 2017; 9(6): 253-268
- URL: https://www.wjgnet.com/1949-8470/full/v9/i6/253.htm
- DOI: https://dx.doi.org/10.4329/wjr.v9.i6.253


