Copyright
©The Author(s) 2017.
World J Radiol. Jun 28, 2017; 9(6): 253-268
Published online Jun 28, 2017. doi: 10.4329/wjr.v9.i6.253
Published online Jun 28, 2017. doi: 10.4329/wjr.v9.i6.253
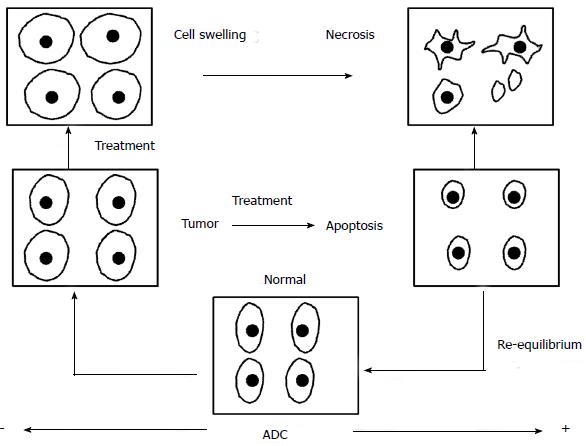
Figure 1 Diffusion imaging in oncology.
The pictorial diagram depicts the diffusion changes and corresponding ADC values in correlation to the pre and post-treatment tumor microenvironment. Increased cell density in the tumor tissue leads to low ADC values as compared to the normal tissue. When subjected to antitumor therapy the cells undergo swelling in the immediate post-treatment phase which leads to further decrease in the ADC values. Once the cell death cycle sets in the cell membranes are more permeable and diffusivity increases which leads to higher ADC values. This ADC normalizes during the healing phase. ADC: Apparent diffusion coefficient.
- Citation: Mahajan A, Deshpande SS, Thakur MH. Diffusion magnetic resonance imaging: A molecular imaging tool caught between hope, hype and the real world of “personalized oncology”. World J Radiol 2017; 9(6): 253-268
- URL: https://www.wjgnet.com/1949-8470/full/v9/i6/253.htm
- DOI: https://dx.doi.org/10.4329/wjr.v9.i6.253


