Copyright
©The Author(s) 2017.
World J Radiol. May 28, 2017; 9(5): 230-244
Published online May 28, 2017. doi: 10.4329/wjr.v9.i5.230
Published online May 28, 2017. doi: 10.4329/wjr.v9.i5.230
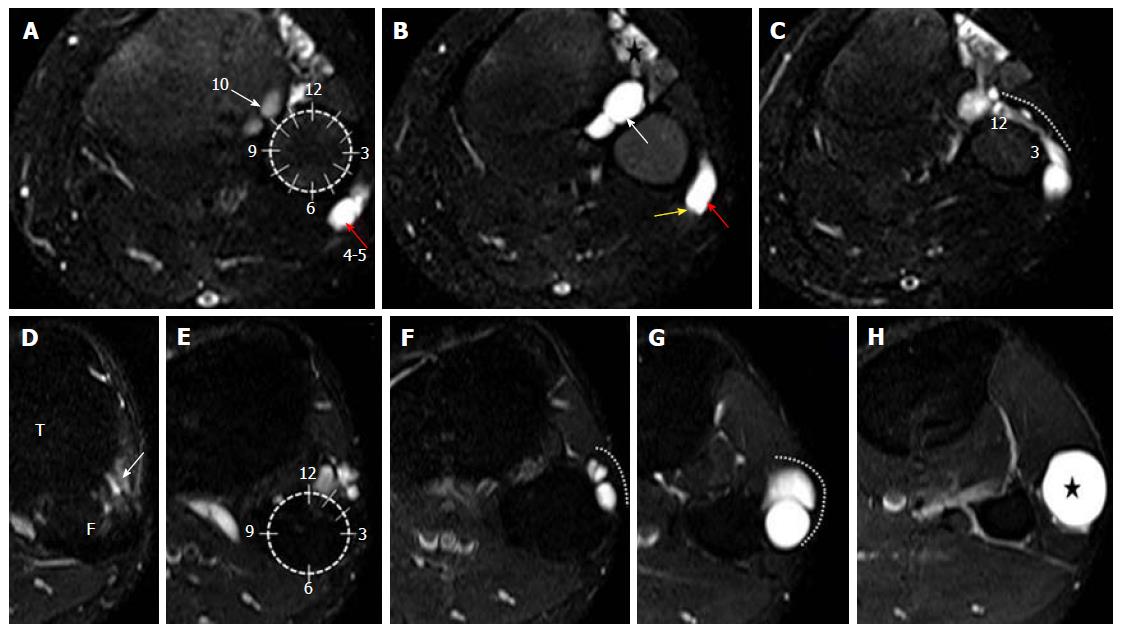
Figure 14 Axial, T2-weighted fat suppressed images A-H of the proximal leg show the left clock face model to differentiate intraneural ganglion cyst from extraneural ganglion cyst.
A-C represent INGC where images A, B (at the upper-mid fibular head level) depict the joint connection of the cyst at the 10 o’clock (white arrows) which signifies the “tail sign”. The cyst (red arrows) within the outer epineurium of the CPN (yellow arrow), between the 4 and 5 o’clock position represents the “signet ring sign”. Image C, (at the level of fibular neck) shows the extension of the cyst along the ascending limb of the articular branch (dotted white line) depicting the “transverse limb sign”. It crosses the anterior surface of fibula from the PTF joint and progresses clockwise from 12-3 o’clock position around the fibular head. On the other hand, images D-H, depicting ENGC show a more superiorly located joint connection (white arrow) in between 12-2 o’clock position in images D, E. It lies anterolateral to the fibula (dotted white line) and never crosses it as seen in images F, G. The cyst (star) is more globular and lying in the intermuscular plane as seen in the image H. INGC: Intraneural ganglion cyst; CPN: Common peroneal nerve; ENGC: Extraneural ganglion cyst; T: Tibia; F: Fibula.
- Citation: Panwar J, Mathew A, Thomas BP. Cystic lesions of peripheral nerves: Are we missing the diagnosis of the intraneural ganglion cyst? World J Radiol 2017; 9(5): 230-244
- URL: https://www.wjgnet.com/1949-8470/full/v9/i5/230.htm
- DOI: https://dx.doi.org/10.4329/wjr.v9.i5.230


