Copyright
©The Author(s) 2017.
World J Radiol. May 28, 2017; 9(5): 230-244
Published online May 28, 2017. doi: 10.4329/wjr.v9.i5.230
Published online May 28, 2017. doi: 10.4329/wjr.v9.i5.230
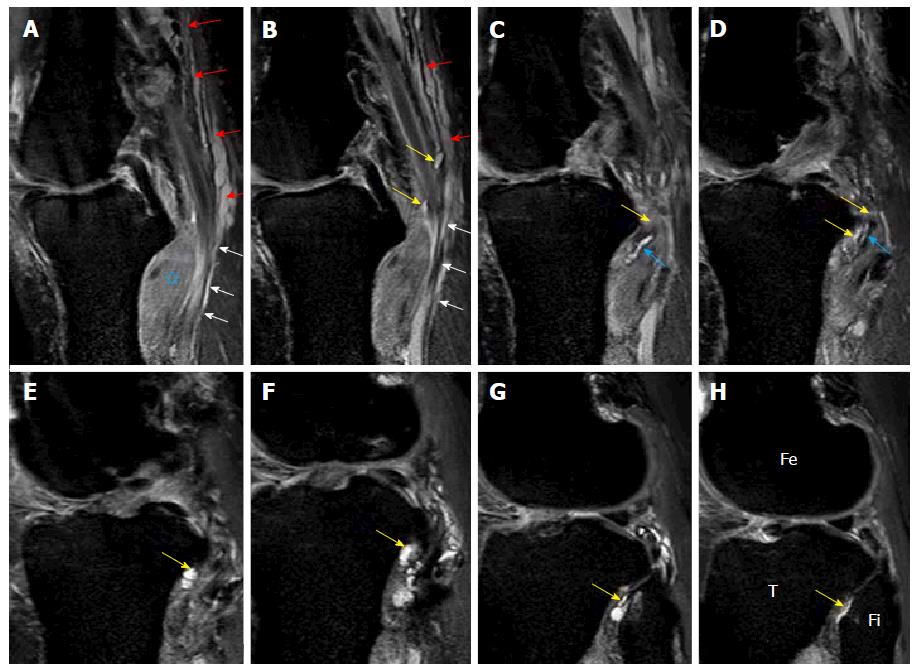
Figure 3 Images A-H show serial, proton density-weighted fat suppressed sagittal sections of the knee demonstrate the longitudinally oriented cystic lesion in the tibial nerve (red arrows) with extension along the articular branch to proximal tibiofibular joint (yellow arrows), branch to popliteus (blue arrows) and tibialis posterior muscles (white arrows).
Note the denervation edema in the popliteus muscle (star). T: Tibia; Fi: Fibula; Fe: Femur.
- Citation: Panwar J, Mathew A, Thomas BP. Cystic lesions of peripheral nerves: Are we missing the diagnosis of the intraneural ganglion cyst? World J Radiol 2017; 9(5): 230-244
- URL: https://www.wjgnet.com/1949-8470/full/v9/i5/230.htm
- DOI: https://dx.doi.org/10.4329/wjr.v9.i5.230


