Copyright
©The Author(s) 2017.
World J Radiol. Mar 28, 2017; 9(3): 134-142
Published online Mar 28, 2017. doi: 10.4329/wjr.v9.i3.134
Published online Mar 28, 2017. doi: 10.4329/wjr.v9.i3.134
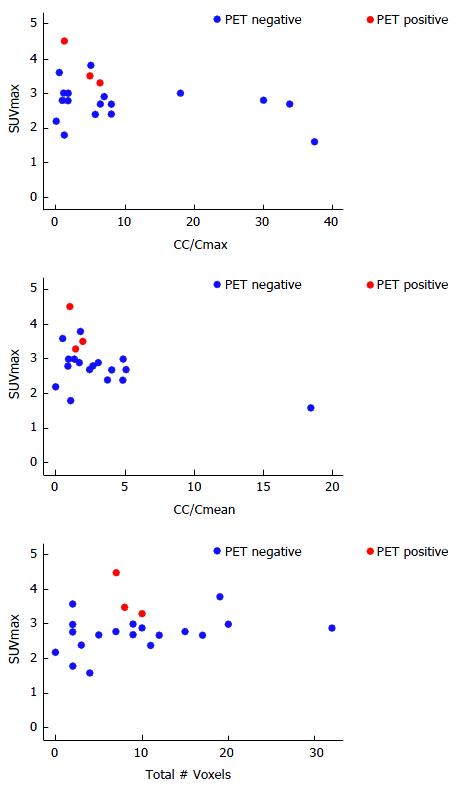
Figure 3 Scatter plots demonstrating the relationships between proton magnetic resonance spectroscopic imaging and 18F-fluorodeoxyglucose positron emission tomography parameters (n = 22).
PET: Positron emission tomography.
- Citation: Shukla-Dave A, Wassberg C, Pucar D, Schöder H, Goldman DA, Mazaheri Y, Reuter VE, Eastham J, Scardino PT, Hricak H. Multimodality imaging using proton magnetic resonance spectroscopic imaging and 18F-fluorodeoxyglucose-positron emission tomography in local prostate cancer. World J Radiol 2017; 9(3): 134-142
- URL: https://www.wjgnet.com/1949-8470/full/v9/i3/134.htm
- DOI: https://dx.doi.org/10.4329/wjr.v9.i3.134


