Copyright
©The Author(s) 2017.
World J Radiol. Oct 28, 2017; 9(10): 371-388
Published online Oct 28, 2017. doi: 10.4329/wjr.v9.i10.371
Published online Oct 28, 2017. doi: 10.4329/wjr.v9.i10.371
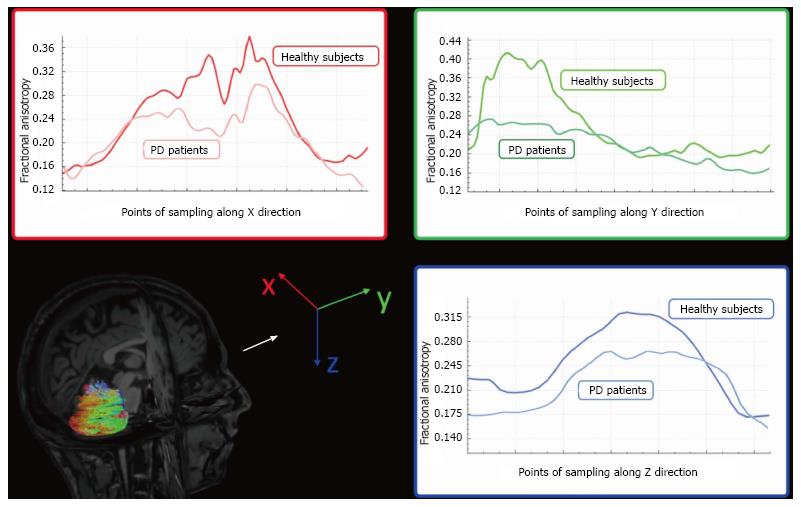
Figure 5 Graphic representations of Fractional Anisotropy mean decrement along X (red), Y (green), and Z (blue) direction samplings of Parkinson’s disease patients compared to healthy subjects.
Colors follow principal eigenvector’s directions (with permission of Springer, from Ref. [63]). PD: Parkinson’s disease.
- Citation: Mormina E, Petracca M, Bommarito G, Piaggio N, Cocozza S, Inglese M. Cerebellum and neurodegenerative diseases: Beyond conventional magnetic resonance imaging. World J Radiol 2017; 9(10): 371-388
- URL: https://www.wjgnet.com/1949-8470/full/v9/i10/371.htm
- DOI: https://dx.doi.org/10.4329/wjr.v9.i10.371


