Copyright
©The Author(s) 2017.
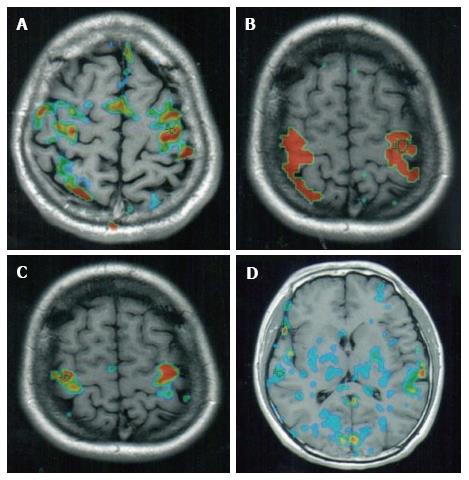
Figure 1 Functional magnetic resonance imaging image of different states.
A: fMRI of a short term heroin addict at rest performing no activity and thus have no bodily stimulation. Note some areas still have high BOLD activity (red); B: fMRI of a short term heroin addict when performing motor and sensory activities. Note BOLD image in different regions showing high upregulation of BOLD (red), medium BOLD activity (yellow). While blue indicates downregulation of BOLD activities; C: fMRI of the same individual in (B) at rest after stimulation. There were still some high activity spots of BOLD after stimulation and at rest (red); D: fMRI of a long term (over 7 years) addict of heroin at rest. Many downregulated BOLD spots in the brain (blue). fMRI: Functional magnetic resonance imaging; BOLD: Blood oxygen level dependent.
- Citation: Chow MSM, Wu SL, Webb SE, Gluskin K, Yew DT. Functional magnetic resonance imaging and the brain: A brief review. World J Radiol 2017; 9(1): 5-9
- URL: https://www.wjgnet.com/1949-8470/full/v9/i1/5.htm
- DOI: https://dx.doi.org/10.4329/wjr.v9.i1.5


