Copyright
©The Author(s) 2016.
World J Radiol. Sep 28, 2016; 8(9): 785-798
Published online Sep 28, 2016. doi: 10.4329/wjr.v8.i9.785
Published online Sep 28, 2016. doi: 10.4329/wjr.v8.i9.785
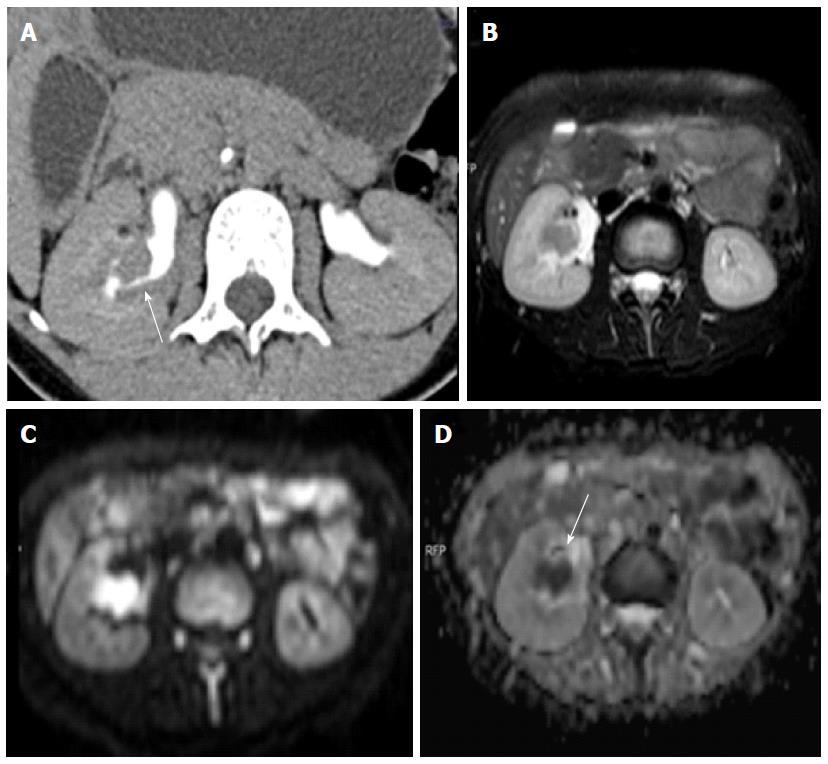
Figure 10 Transitional cell cancer.
Computed tomography urography image (A) shows a filling defect within the mid-pole calyx and infundibular region. Axial T2W image (B) showing a corresponding hypointense lesion showing restricted diffusion on diffusion weighted imaging (C, D).
- Citation: Baliyan V, Das CJ, Sharma R, Gupta AK. Diffusion weighted imaging: Technique and applications. World J Radiol 2016; 8(9): 785-798
- URL: https://www.wjgnet.com/1949-8470/full/v8/i9/785.htm
- DOI: https://dx.doi.org/10.4329/wjr.v8.i9.785


