Copyright
©The Author(s) 2016.
World J Radiol. Sep 28, 2016; 8(9): 785-798
Published online Sep 28, 2016. doi: 10.4329/wjr.v8.i9.785
Published online Sep 28, 2016. doi: 10.4329/wjr.v8.i9.785
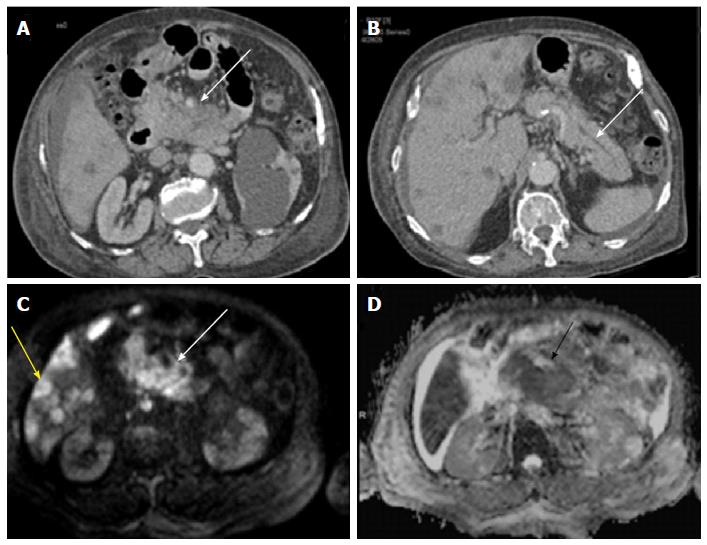
Figure 7 Pancreatic adenocarcinoma.
Axial CECT images showing a hypo-enhancing mass in the neck and head region of pancreas (A) with a dilated pancreatic duct (B); multiple hypodense lesions can be noted within the liver parenchyma. Mass in the neck and head region of pancreas is showing hyperintense signal on b800 image and so are the focal liver lesions (C); corresponding apparent diffusion coefficient map shows hypointense signal within the mass (D).
- Citation: Baliyan V, Das CJ, Sharma R, Gupta AK. Diffusion weighted imaging: Technique and applications. World J Radiol 2016; 8(9): 785-798
- URL: https://www.wjgnet.com/1949-8470/full/v8/i9/785.htm
- DOI: https://dx.doi.org/10.4329/wjr.v8.i9.785


