Copyright
©The Author(s) 2016.
World J Radiol. Sep 28, 2016; 8(9): 785-798
Published online Sep 28, 2016. doi: 10.4329/wjr.v8.i9.785
Published online Sep 28, 2016. doi: 10.4329/wjr.v8.i9.785
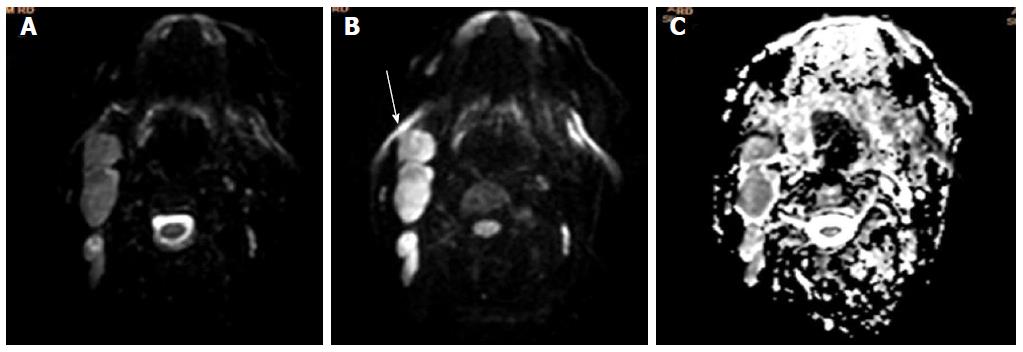
Figure 2 Non-hodgkin’s lymphoma.
Axial b0 (A), b1000 (B) and apparent diffusion coefficient map are showing multiple enlarged neck nodes. Nodes are showing slightly hyperintense signal on b0 images and retaining their signal on b1000 image with low signal on corresponding ADC (C). ADC: Apparent diffusion coefficient.
- Citation: Baliyan V, Das CJ, Sharma R, Gupta AK. Diffusion weighted imaging: Technique and applications. World J Radiol 2016; 8(9): 785-798
- URL: https://www.wjgnet.com/1949-8470/full/v8/i9/785.htm
- DOI: https://dx.doi.org/10.4329/wjr.v8.i9.785


