Copyright
©The Author(s) 2016.
World J Radiol. Sep 28, 2016; 8(9): 764-774
Published online Sep 28, 2016. doi: 10.4329/wjr.v8.i9.764
Published online Sep 28, 2016. doi: 10.4329/wjr.v8.i9.764
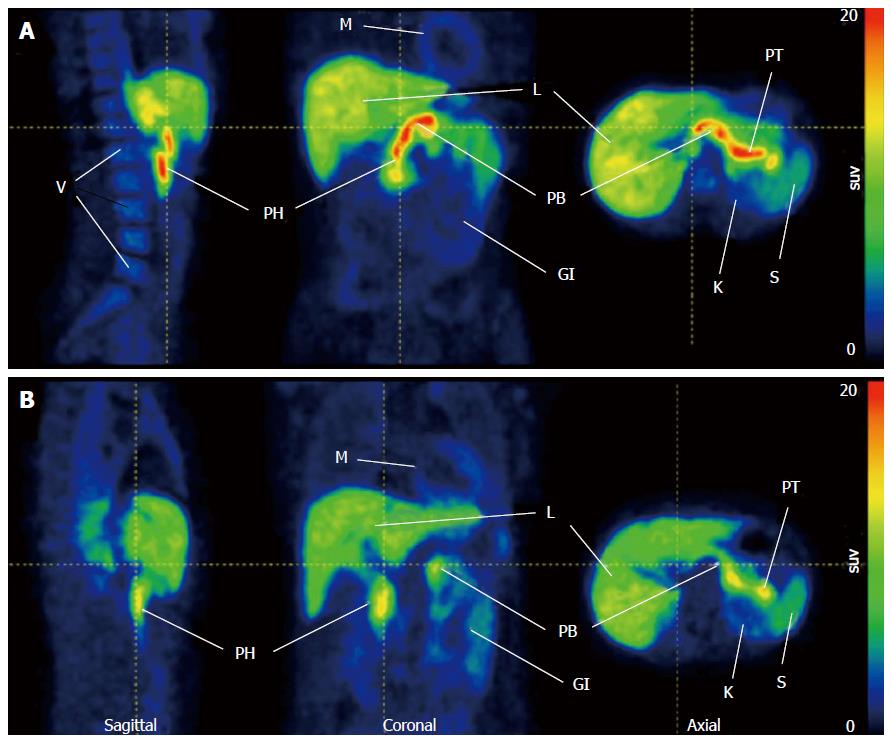
Figure 2 Representative 18F-FP-(+)-DTBZ positron emission tomography images in healthy control subject and type 1 diabetes patient.
A: High uptake in healthy pancreas; B: Compare with health control pancreas, lower uptake was observed in T1D patient. Both images PET data summed 0-90 min p.i. Reprinted with permission from Ref.[14]. GI: Gastrointestinal tract; K: Kidney; L: Liver; M: Myocardium; PB: Pancreas body; PH: Pancreas head; PT: Pancreas tail; S: Spleen; V: Vertebrae; T1D: Type 1 diabetes; PET: Positron emission tomography.
- Citation: Li J, Karunananthan J, Pelham B, Kandeel F. Imaging pancreatic islet cells by positron emission tomography. World J Radiol 2016; 8(9): 764-774
- URL: https://www.wjgnet.com/1949-8470/full/v8/i9/764.htm
- DOI: https://dx.doi.org/10.4329/wjr.v8.i9.764


