Copyright
©The Author(s) 2016.
World J Radiol. Aug 28, 2016; 8(8): 757-763
Published online Aug 28, 2016. doi: 10.4329/wjr.v8.i8.757
Published online Aug 28, 2016. doi: 10.4329/wjr.v8.i8.757
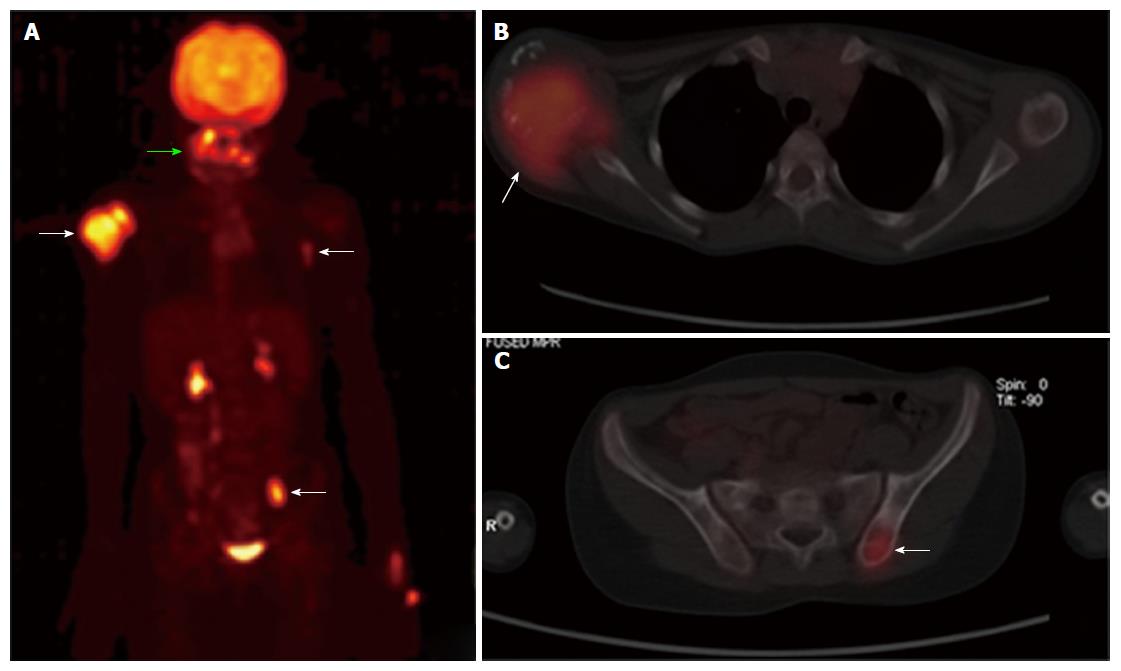
Figure 8 Positron emission tomography-computed tomography whole body maximum intensity projection image (A), axial fused images of chest (B) and pelvis (C) reveal areas of increased fluorodeoxyglucose uptake in right humeral head (arrow), the paranasal sinuses (green arrow), left thoracic wall (arrow) and left iliac bone (arrow).
Note the physiological uptake and excretion in the kidneys and urinary bladder.
- Citation: Vallonthaiel AG, Mridha AR, Gamanagatti S, Jana M, Sharma MC, Khan SA, Bakhshi S. Unusual presentation of Erdheim-Chester disease in a child with acute lymphoblastic leukemia. World J Radiol 2016; 8(8): 757-763
- URL: https://www.wjgnet.com/1949-8470/full/v8/i8/757.htm
- DOI: https://dx.doi.org/10.4329/wjr.v8.i8.757


