Copyright
©The Author(s) 2016.
World J Radiol. Aug 28, 2016; 8(8): 750-756
Published online Aug 28, 2016. doi: 10.4329/wjr.v8.i8.750
Published online Aug 28, 2016. doi: 10.4329/wjr.v8.i8.750
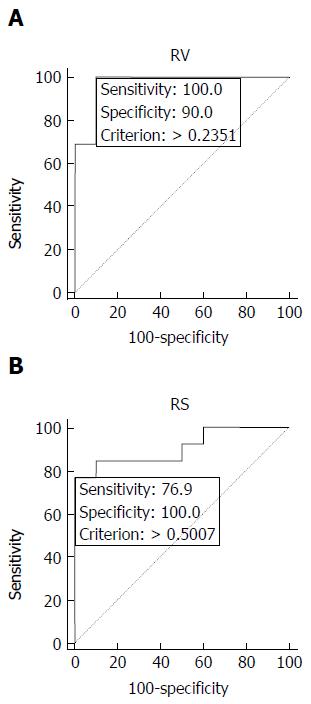
Figure 2 Receiver-operator characteristic curves analysis of relative volume and relative surface.
RV (A) performed best with a threshold of 0.23 (sensitivity 100%, specificity 90%), while RS (B) with a threshold of 0.50 (sensitivity 77%, specificity 90%). RV: Relative volume; RS: Relative surface.
- Citation: Ippolito D, Masetto A, Talei Franzesi C, Bonaffini PA, Casiraghi A, Sironi S. Relative volume measured with magnetic resonance imaging is an articular collapse predictor in hematological pediatric patients with femoral head osteonecrosis. World J Radiol 2016; 8(8): 750-756
- URL: https://www.wjgnet.com/1949-8470/full/v8/i8/750.htm
- DOI: https://dx.doi.org/10.4329/wjr.v8.i8.750


