Copyright
©The Author(s) 2016.
World J Radiol. Aug 28, 2016; 8(8): 729-734
Published online Aug 28, 2016. doi: 10.4329/wjr.v8.i8.729
Published online Aug 28, 2016. doi: 10.4329/wjr.v8.i8.729
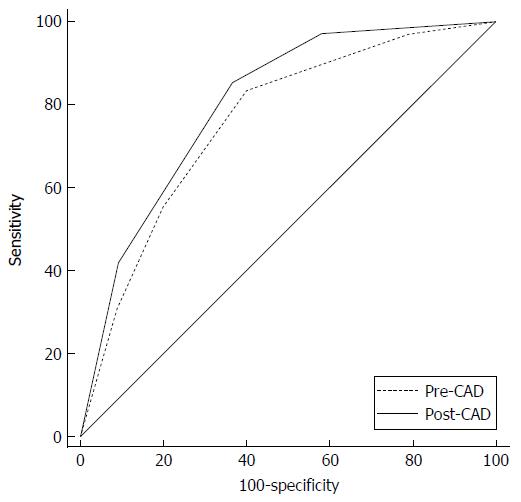
Figure 2 Graphical representation of overall receiver operating characteristic curve comparison.
Post-computer-aided diagnosis receiver operating characteristic curve (solid line) is constantly superior to the pre-computer-aided diagnosis curve (dotted line). CAD: Computer-aided diagnosis.
- Citation: Perandini S, Soardi GA, Motton M, Augelli R, Dallaserra C, Puntel G, Rossi A, Sala G, Signorini M, Spezia L, Zamboni F, Montemezzi S. Enhanced characterization of solid solitary pulmonary nodules with Bayesian analysis-based computer-aided diagnosis. World J Radiol 2016; 8(8): 729-734
- URL: https://www.wjgnet.com/1949-8470/full/v8/i8/729.htm
- DOI: https://dx.doi.org/10.4329/wjr.v8.i8.729


