Copyright
©The Author(s) 2016.
World J Radiol. Jul 28, 2016; 8(7): 683-692
Published online Jul 28, 2016. doi: 10.4329/wjr.v8.i7.683
Published online Jul 28, 2016. doi: 10.4329/wjr.v8.i7.683
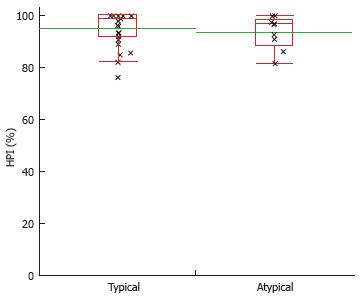
Figure 4 Scattered plot showing the distribution of hepatic perfusion index in typical vs atypical hepatocellular carcinoma in n = 36 hepatocellular carcinoma lesions.
The green line indicates the mean value (typical vs atypical 95.0% vs 93.7%, respectively). The red Boxes indicate the box-and-whisker plots indicating the upper and lower quartiles. HPI: Hepatic perfusion index.
- Citation: Grözinger G, Bitzer M, Syha R, Ketelsen D, Nikolaou K, Lauer U, Horger M. Correlation of magnetic resonance signal characteristics and perfusion parameters assessed by volume perfusion computed tomography in hepatocellular carcinoma: Impact on lesion characterization. World J Radiol 2016; 8(7): 683-692
- URL: https://www.wjgnet.com/1949-8470/full/v8/i7/683.htm
- DOI: https://dx.doi.org/10.4329/wjr.v8.i7.683


