Copyright
©The Author(s) 2016.
World J Radiol. Jun 28, 2016; 8(6): 618-627
Published online Jun 28, 2016. doi: 10.4329/wjr.v8.i6.618
Published online Jun 28, 2016. doi: 10.4329/wjr.v8.i6.618
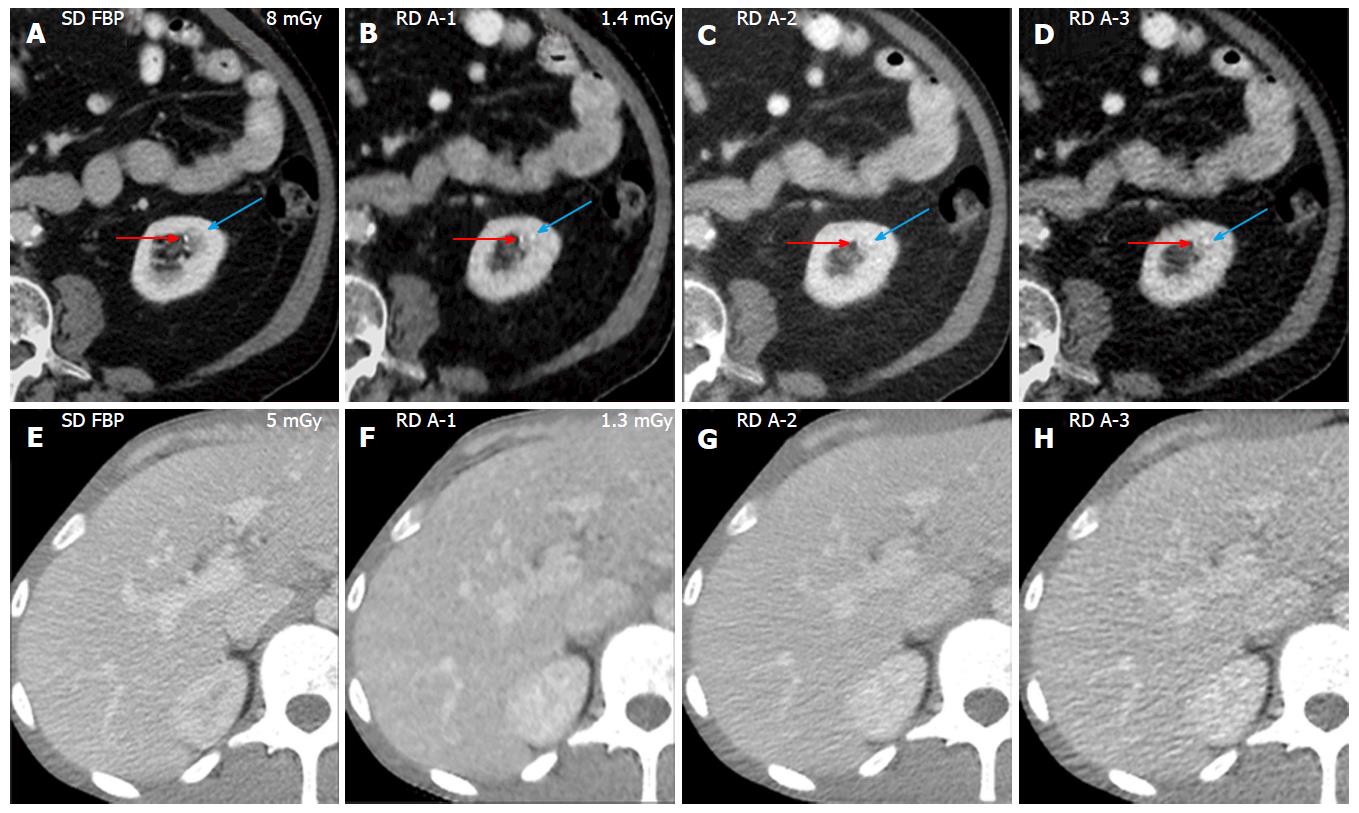
Figure 1 Top row (A-D) and bottom row (E-H) of a 71-year-old male.
A-D: Transverse abdominal CT images of a 71-year-old male (BMI 24 kg/m2) acquired at SD FBP (8 mGy) and RD (1.4 mGy) (reconstructed with A-1, A-2, and A-3). The left kidney stone (red arrows) was optimally depicted on SD FBP (A). However, left kidney stone was missed on RD A-1, RD A-2, and RD A-3 images (B-D). In addition, probably pseudo kidney stone (blue arrows) was seen on RD A-1, RD A-2, and RD A-3 images; E-H: Transverse abdominal CT images of a 3-year-old male (BMI 20 kg/m2) acquired at SD FBP (5 mGy) and RD (1.3 mGy) reconstructed with A-1, A-2, and A-3. The liver parenchyma was optimally depicted on SD FBP, scored sufficiently on RD A-2, and limited on RD A-1 and RD A-3 images. SD: Standard of care; FBP: Filtered back projection; RD: Reduced dose; BMI: Body mass index; CT: Computed tomography.
- Citation: Padole A, Sainani N, Lira D, Khawaja RDA, Pourjabbar S, Lo Gullo R, Otrakji A, Kalra MK. Assessment of sub-milli-sievert abdominal computed tomography with iterative reconstruction techniques of different vendors. World J Radiol 2016; 8(6): 618-627
- URL: https://www.wjgnet.com/1949-8470/full/v8/i6/618.htm
- DOI: https://dx.doi.org/10.4329/wjr.v8.i6.618


