Copyright
©The Author(s) 2016.
World J Radiol. Jun 28, 2016; 8(6): 588-593
Published online Jun 28, 2016. doi: 10.4329/wjr.v8.i6.588
Published online Jun 28, 2016. doi: 10.4329/wjr.v8.i6.588
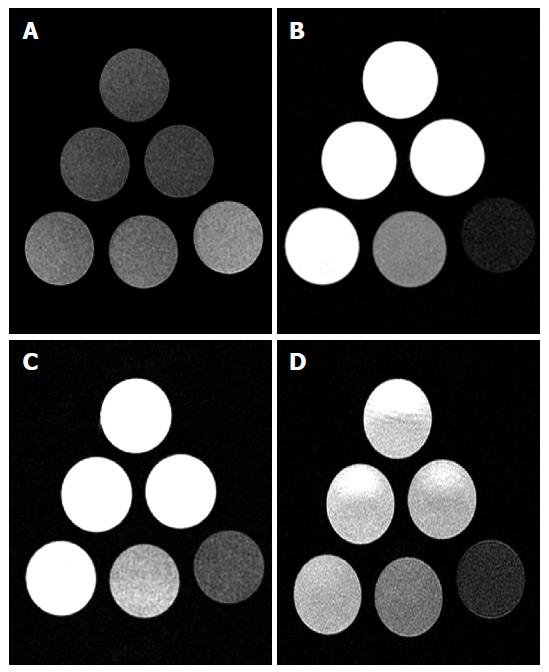
Figure 1 In vitro phantom magnetic resonance images at 3T.
T1-WI (A), T2-WI (B), gradient-echo (GRE) (C) and fluid-attenuation-inversion-recovery (FLAIR) (D) magnetic resonance images of various aliquots of Iopamidol. Distribution in the phantom as follow: Bottom right, undiluted 100% contrast media; Bottom middle, 50%; Bottom left, 25%; Mid-row right, 12.5%; Mid-row left, 6.25% and Top, physiologic saline. Note significant hypo intensity of the higher concentrations of iodinated contrast on T2-WI (B), yielding the highest contrast to noise ratios. Conspicuity on FLAIR, GRE and particularly on T1-WI (hyper intensity respect to saline) is reduced as compared with T2-WI.
- Citation: Morales H, Lemen L, Samaratunga R, Nguyen P, Tomsick T. Effects of iodinated contrast on various magnetic resonance imaging sequences and field strength: Implications for characterization of hemorrhagic transformation in acute stroke therapy. World J Radiol 2016; 8(6): 588-593
- URL: https://www.wjgnet.com/1949-8470/full/v8/i6/588.htm
- DOI: https://dx.doi.org/10.4329/wjr.v8.i6.588


