Copyright
©The Author(s) 2016.
World J Radiol. Jun 28, 2016; 8(6): 556-570
Published online Jun 28, 2016. doi: 10.4329/wjr.v8.i6.556
Published online Jun 28, 2016. doi: 10.4329/wjr.v8.i6.556
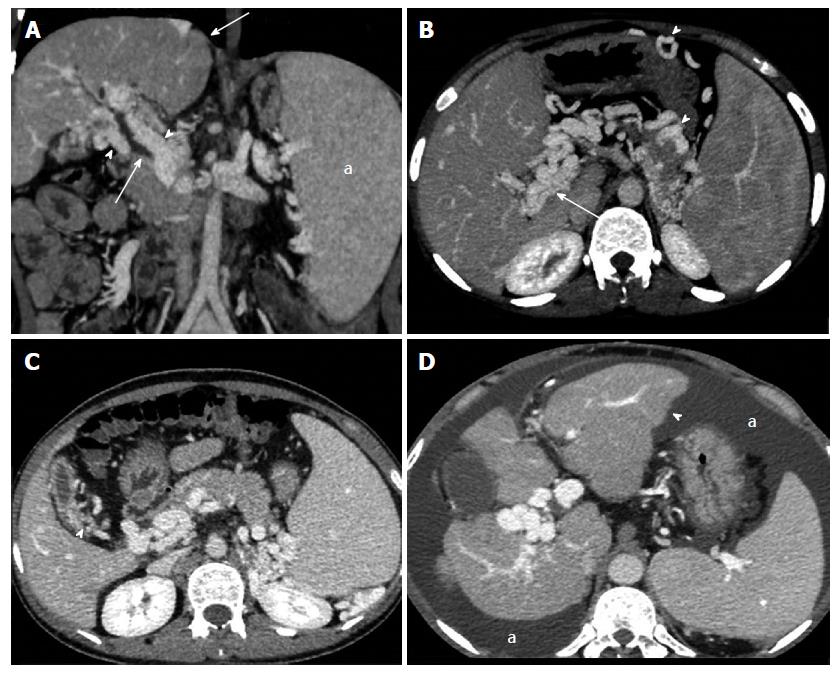
Figure 3 Vascular, biliary and visceral changes on multidetector computed tomography.
A: Coronal image shows paracholedochal collaterals (arrow heads) indenting the biliary tree (thin arrow) and causing upstream biliary dilatation. Note the normal liver outlines (thick arrow) and enlarged spleen (a); B: Thick maximum intensity projection image depicts portal cavernoma formation (thin arrow), perigastric and pancreatic collaterals (arrow heads); C: Contracted gallbladder with pericholecystic varices (arrow head); D: A patient of extrahepatic portal vein obstruction showing lobulated liver contours (arrow head) and ascites (a).
- Citation: Pargewar SS, Desai SN, Rajesh S, Singh VP, Arora A, Mukund A. Imaging and radiological interventions in extra-hepatic portal vein obstruction. World J Radiol 2016; 8(6): 556-570
- URL: https://www.wjgnet.com/1949-8470/full/v8/i6/556.htm
- DOI: https://dx.doi.org/10.4329/wjr.v8.i6.556


