Copyright
©The Author(s) 2016.
World J Radiol. Apr 28, 2016; 8(4): 397-402
Published online Apr 28, 2016. doi: 10.4329/wjr.v8.i4.397
Published online Apr 28, 2016. doi: 10.4329/wjr.v8.i4.397
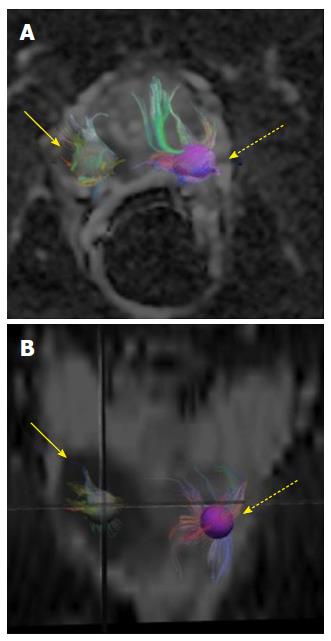
Figure 2 Axial (A) and coronal apparent diffusion coefficient (B) images with superimposed three dimensional fiber tracts in the two three dimensional-regions of interests.
The tumor (arrows in A, B) in the right mid peripheral zone is well demarcated in this 59-year-old man with a Gleason’s score of 8. Decreased number of fibers passing through the tumor region regions of interest in comparison with the normal region (dotted arrows in A, B) is subjectively apparent. The quantitative tract densities were 1.48 in the tumor region and 2.09 in the normal region.
- Citation: Hedgire S, Tonyushkin A, Kilcoyne A, Efstathiou JA, Hahn PF, Harisinghani M. Quantitative study of prostate cancer using three dimensional fiber tractography. World J Radiol 2016; 8(4): 397-402
- URL: https://www.wjgnet.com/1949-8470/full/v8/i4/397.htm
- DOI: https://dx.doi.org/10.4329/wjr.v8.i4.397


