Copyright
©The Author(s) 2016.
World J Radiol. Apr 28, 2016; 8(4): 397-402
Published online Apr 28, 2016. doi: 10.4329/wjr.v8.i4.397
Published online Apr 28, 2016. doi: 10.4329/wjr.v8.i4.397
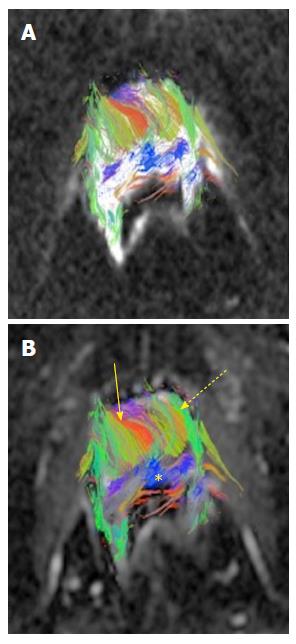
Figure 1 Three dimensional fiber tracts superimposed on axial diffusion weighted images (A) and apparent diffusion coefficient (B) image revealing rich fiber tract anatomy and complex architecture of the prostate gland with tract heterogeneity.
The visualization software allows color-coding of the tracts wherein the tractographic fiber display shows right/left (red - straight arrow), anterior/posterior (green - dotted arrow), superior/inferior (blue) tracts based on the eigenvector orientations.
- Citation: Hedgire S, Tonyushkin A, Kilcoyne A, Efstathiou JA, Hahn PF, Harisinghani M. Quantitative study of prostate cancer using three dimensional fiber tractography. World J Radiol 2016; 8(4): 397-402
- URL: https://www.wjgnet.com/1949-8470/full/v8/i4/397.htm
- DOI: https://dx.doi.org/10.4329/wjr.v8.i4.397


