Copyright
©The Author(s) 2016.
World J Radiol. Mar 28, 2016; 8(3): 308-315
Published online Mar 28, 2016. doi: 10.4329/wjr.v8.i3.308
Published online Mar 28, 2016. doi: 10.4329/wjr.v8.i3.308
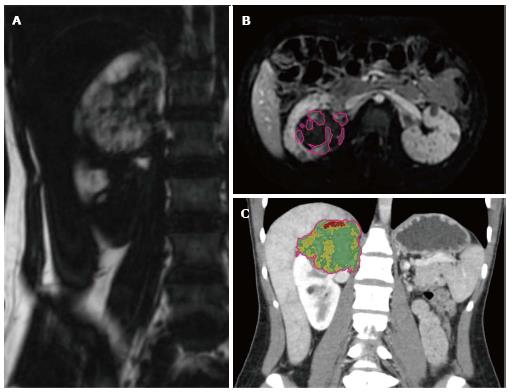
Figure 1 Examples of volumetric analysis on computed tomography and magnetic resonance imaging.
A: Coronal “fat-only” maps created from in- and opposed-phase gradient recalled imaging were used to measure macroscopic fat volumes within AMLs; B: Segmentation of tumoral vascularity (automatically generated regions of interest demarcated by pink line) from post-contrast subtraction imaging was used to calculate tumor vascular volumes; C: Histogram analysis from CT was used to calculate tumoral fat and vascular content (pseudocoloring depicts fatty tissue as red and vascular tissue as yellow). CT: Computed tomography; AML: Angiomyolipoma.
- Citation: Sheth RA, Feldman AS, Paul E, Thiele EA, Walker TG. Angiographic and volumetric effects of mammalian target of rapamycin inhibitors on angiomyolipomas in tuberous sclerosis. World J Radiol 2016; 8(3): 308-315
- URL: https://www.wjgnet.com/1949-8470/full/v8/i3/308.htm
- DOI: https://dx.doi.org/10.4329/wjr.v8.i3.308


