Copyright
©The Author(s) 2016.
World J Radiol. Mar 28, 2016; 8(3): 288-297
Published online Mar 28, 2016. doi: 10.4329/wjr.v8.i3.288
Published online Mar 28, 2016. doi: 10.4329/wjr.v8.i3.288
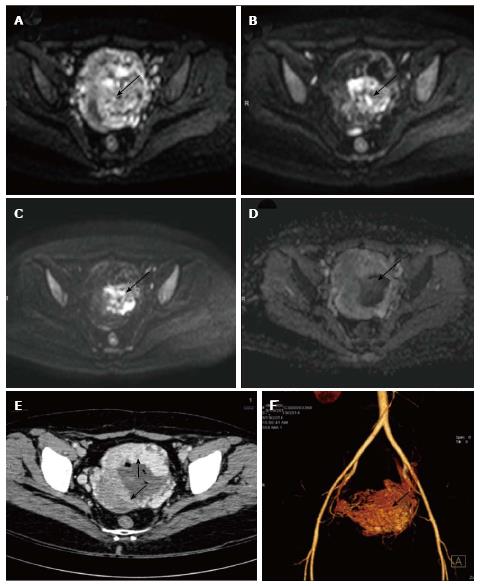
Figure 6 Gestational trophoblastic tumor.
Axial diffusion weighted imaging b 0 (A), b 400 (B) and b 800 (C) and images of known case of gestational trophoblastic tumor shows significant restricted diffusion in the center of the mass (arrow). Note there is spurious restriction in ADC image (D). Axial contrast enhanced CT (E) showing the enhancing uterine mass (arrows) with nonenhancing central area likely hemorrhage which is responsible for the spurious diffusion restriction on DWI. CT angiography image (F) showing marked vascularity of the mass leading to intratumoral hemorrhage. ADC: Apparent diffusion coefficient; DWI: Diffusion weighted imaging; CT: Computed tomography.
- Citation: Manoharan D, Das CJ, Aggarwal A, Gupta AK. Diffusion weighted imaging in gynecological malignancies - present and future. World J Radiol 2016; 8(3): 288-297
- URL: https://www.wjgnet.com/1949-8470/full/v8/i3/288.htm
- DOI: https://dx.doi.org/10.4329/wjr.v8.i3.288


