Copyright
©The Author(s) 2016.
World J Radiol. Mar 28, 2016; 8(3): 281-287
Published online Mar 28, 2016. doi: 10.4329/wjr.v8.i3.281
Published online Mar 28, 2016. doi: 10.4329/wjr.v8.i3.281
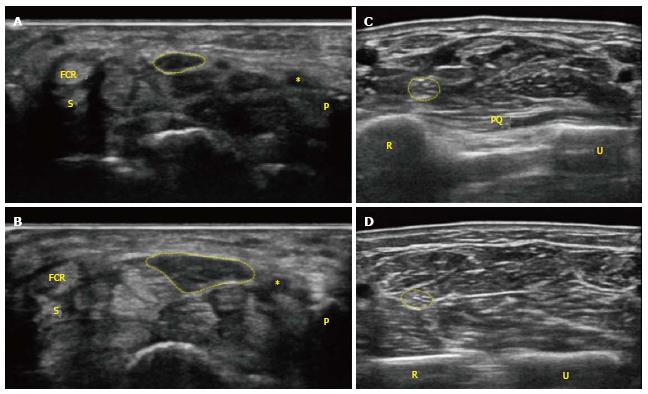
Figure 2 Transverse images in a 79-year-old female with carpal tunnel syndrome.
A: A conventional grey scale sonographic image shows the cross-sectional area of the median nerve (CSA) corresponding to the circle in the normal side with an area of 8 mm2 at the level of the pisiform bone; B: CSA in the carpal tunnel syndrome (CTS) side shows 21 mm2 at pisiform bone level; C: CSA in the CTS side shows 7 mm2 at the proximal third of the pronator quadratus level; D: CSA in the CTS side shows 6 mm2 at a point 12 cm proximal to the pisiform bone. In this case, the calculated “delta CSA” and “CSA ratio” were 14 mm2 and 3.5, respectively. *: Ulnar artery. FCR: Flexor carpi radialis; P: Pisiform bone; S: Scaphoid bone; PQ: Pronator quadratus muscle; R: Radius; U: Ulnar.
- Citation: Miyamoto H, Morizaki Y, Kashiyama T, Tanaka S. Grey-scale sonography and sonoelastography for diagnosing carpal tunnel syndrome. World J Radiol 2016; 8(3): 281-287
- URL: https://www.wjgnet.com/1949-8470/full/v8/i3/281.htm
- DOI: https://dx.doi.org/10.4329/wjr.v8.i3.281


