Copyright
©The Author(s) 2016.
World J Radiol. Mar 28, 2016; 8(3): 240-254
Published online Mar 28, 2016. doi: 10.4329/wjr.v8.i3.240
Published online Mar 28, 2016. doi: 10.4329/wjr.v8.i3.240
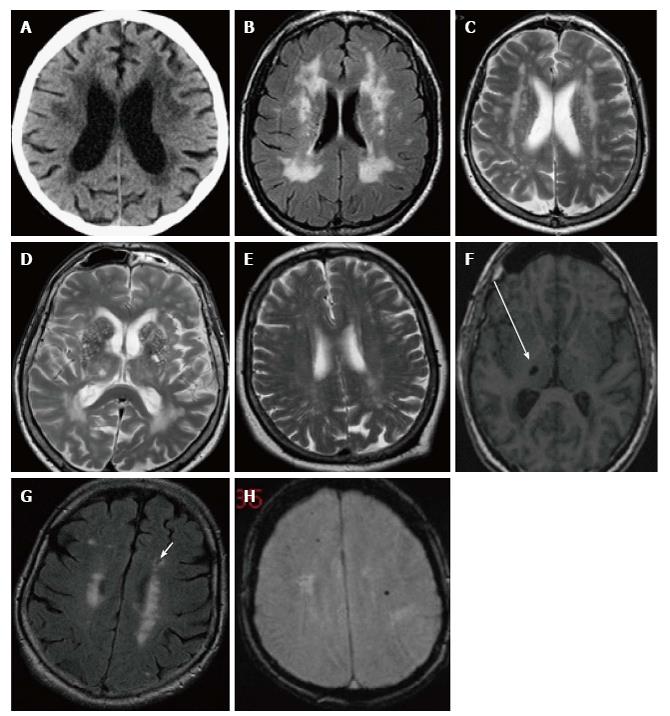
Figure 6 Computed tomography and magnetic resonance imaging images demonstrating structural changes secondary to cerebral small vessel disease.
A: Axial image of CT brain demonstrating periventricular white matter low attenuation changes; B and C: The same seen as periventricular white matter high signal areas on FLAIR and T2 MRI; D: Prominent perivascular spaces typically seen in the basal ganglia; E: Centrum semiovale; F: Focal lacune, a cerebrospinal fluid filled space, sequelae of an old lacunar infarct in the right thalamus seen here (arrow) on an axial T1 image; G: Lacune (arrow) in the left frontal lobe on a FLAIR image, usually with a rim of high signal differentiating from a PVS; H: Cerebral microhaemorrhages, seen here as focal rounded black/low signal foci in the white matter of both frontal lobes on T2* gradient echo MRI. MRI: Magnetic resonance imaging; CT: Computed tomography.
- Citation: Narayanan L, Murray AD. What can imaging tell us about cognitive impairment and dementia? World J Radiol 2016; 8(3): 240-254
- URL: https://www.wjgnet.com/1949-8470/full/v8/i3/240.htm
- DOI: https://dx.doi.org/10.4329/wjr.v8.i3.240


