Copyright
©The Author(s) 2016.
World J Radiol. Feb 28, 2016; 8(2): 183-191
Published online Feb 28, 2016. doi: 10.4329/wjr.v8.i2.183
Published online Feb 28, 2016. doi: 10.4329/wjr.v8.i2.183
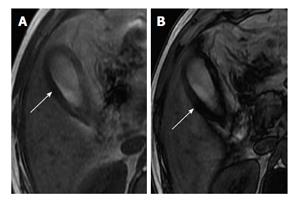
Figure 12 3.
0 T magnetic resonance axial chemical shift imaging using in-phase (A) and out-phase sequences (B). Presence of intramural fat is markedly evident in the form of loss of signal from gallbladder wall on out of phase imaging (arrow) compared to in-phase image (arrow).
- Citation: Singh VP, Rajesh S, Bihari C, Desai SN, Pargewar SS, Arora A. Xanthogranulomatous cholecystitis: What every radiologist should know. World J Radiol 2016; 8(2): 183-191
- URL: https://www.wjgnet.com/1949-8470/full/v8/i2/183.htm
- DOI: https://dx.doi.org/10.4329/wjr.v8.i2.183


